Greenwich Buyer vs. Seller Leverage Index
Follow Greenwich buyer-seller leverage using price momentum, inventory, market speed, and closing liquidity on a transparent 0–100 scale.
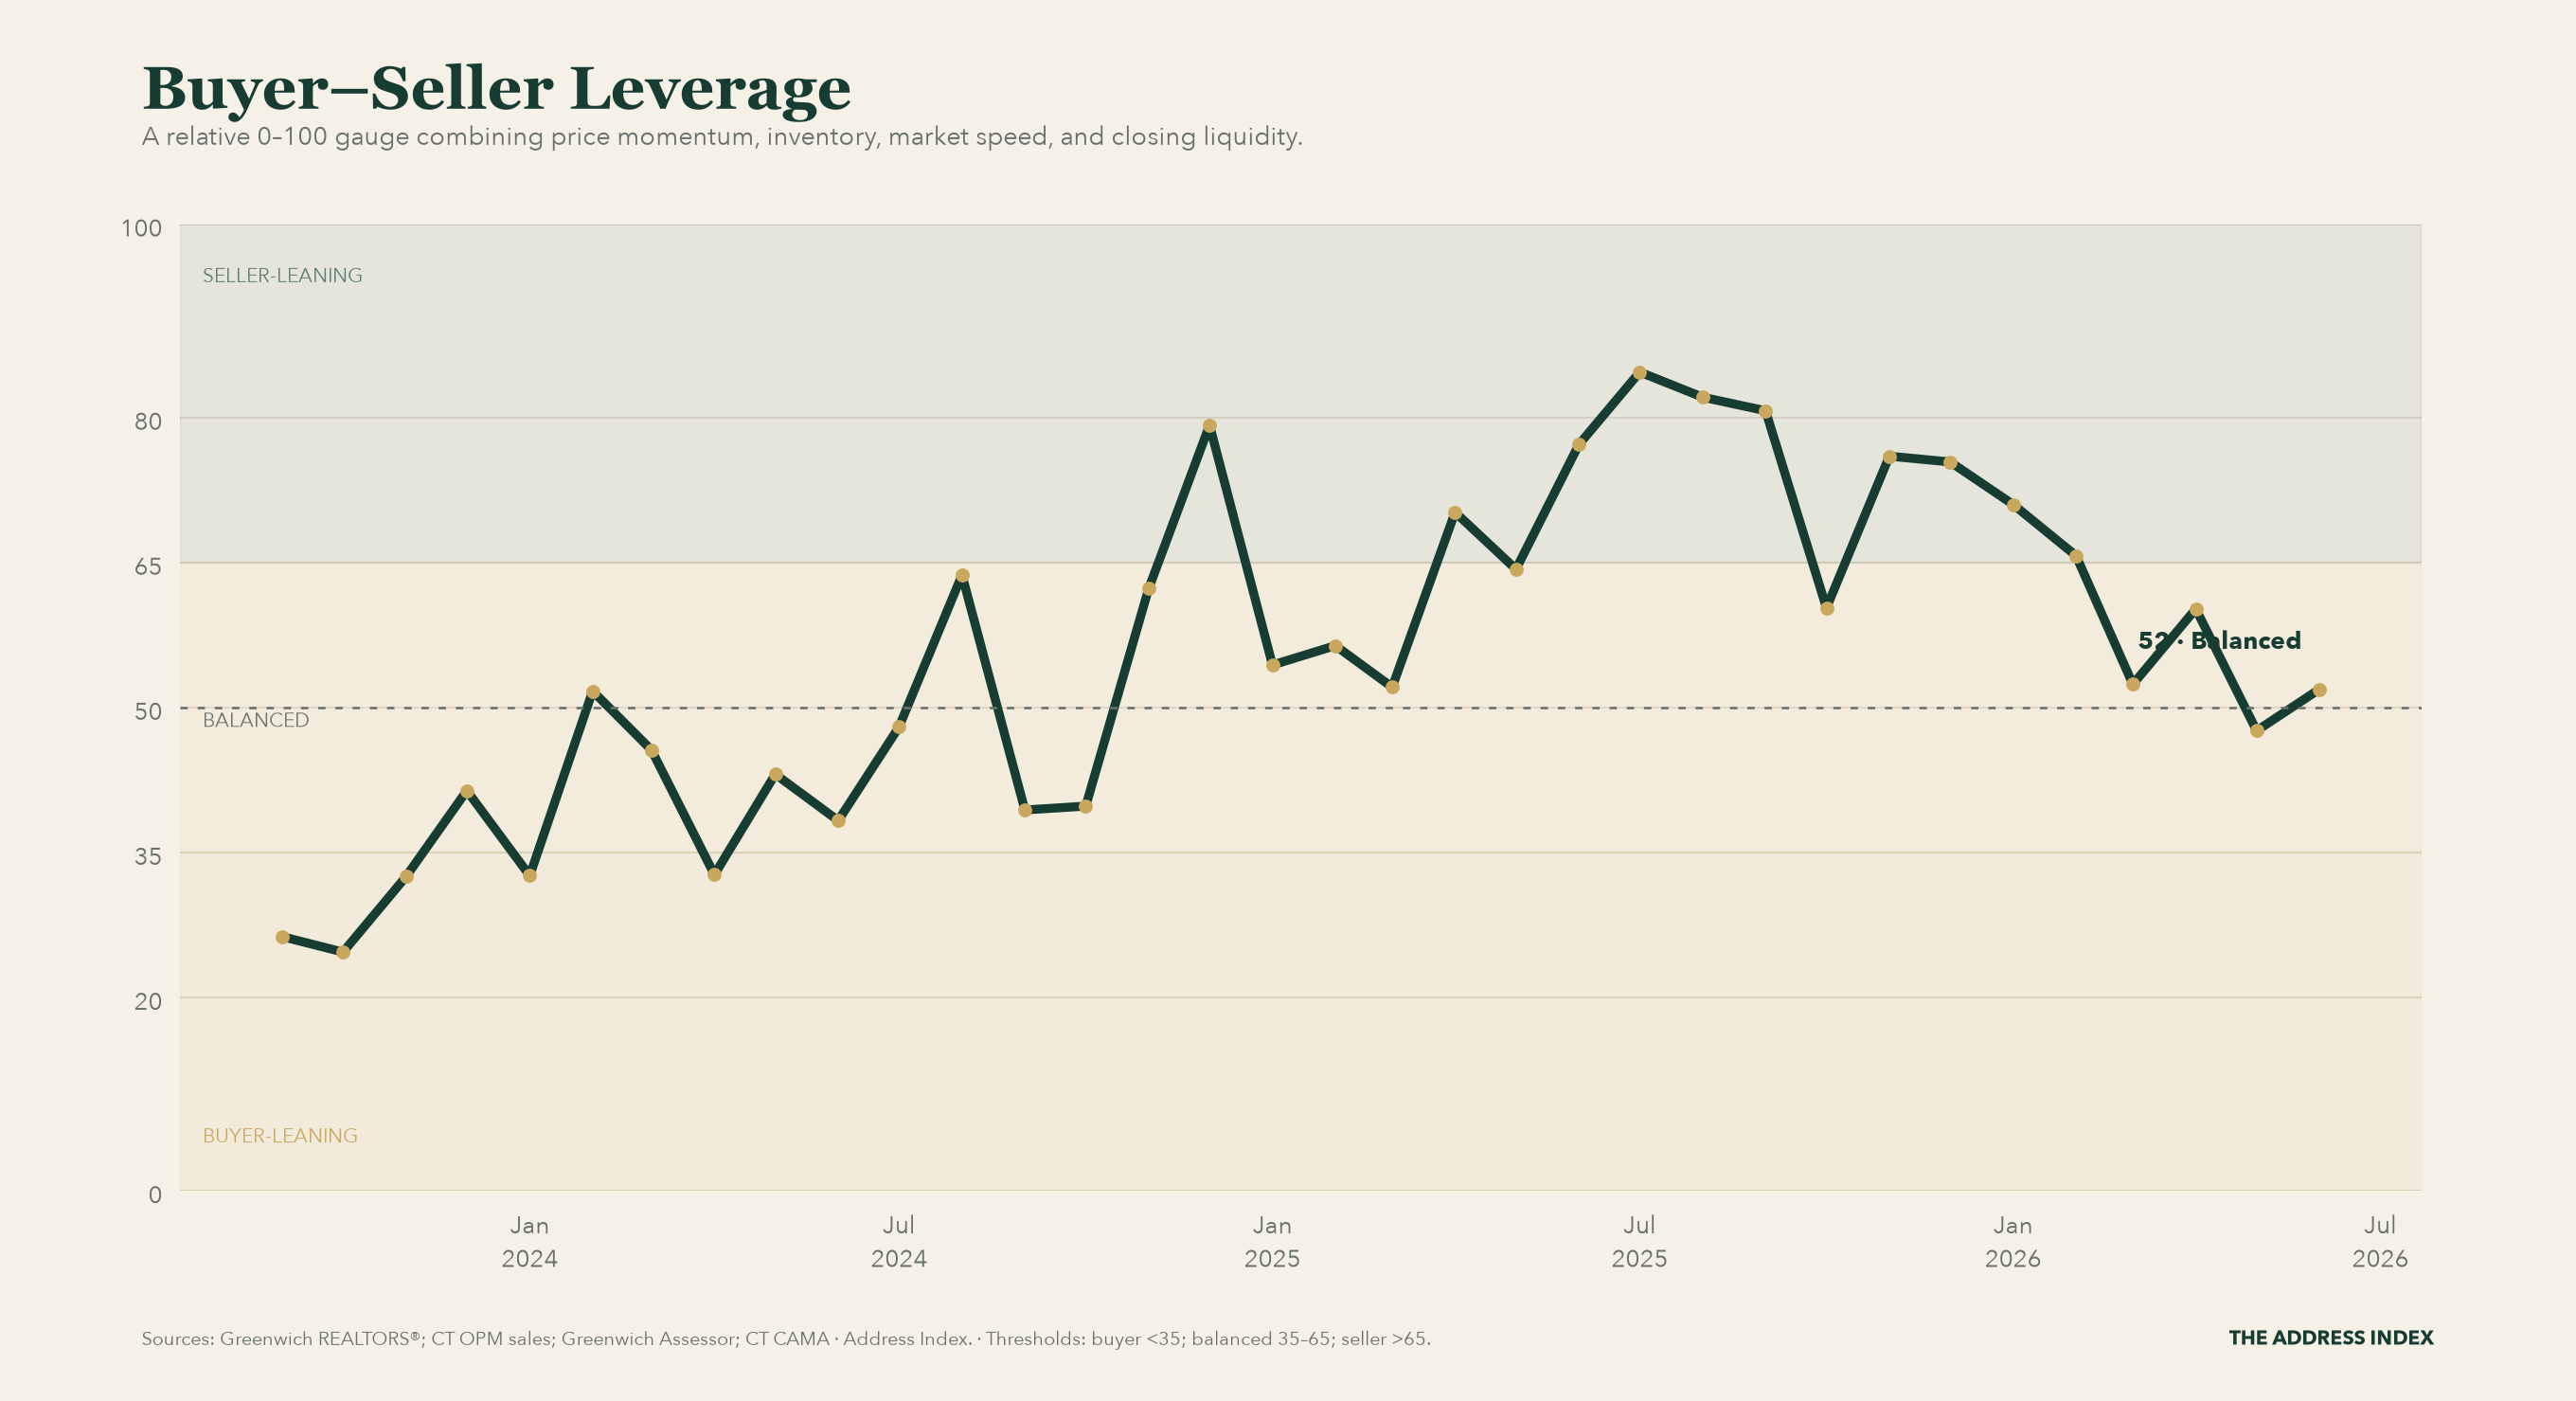
Greenwich's leverage score was 53/100 in July 2026 (balanced). The score ranks four public market signals against the displayed Greenwich history; it is a relative balance gauge, not a forecast.
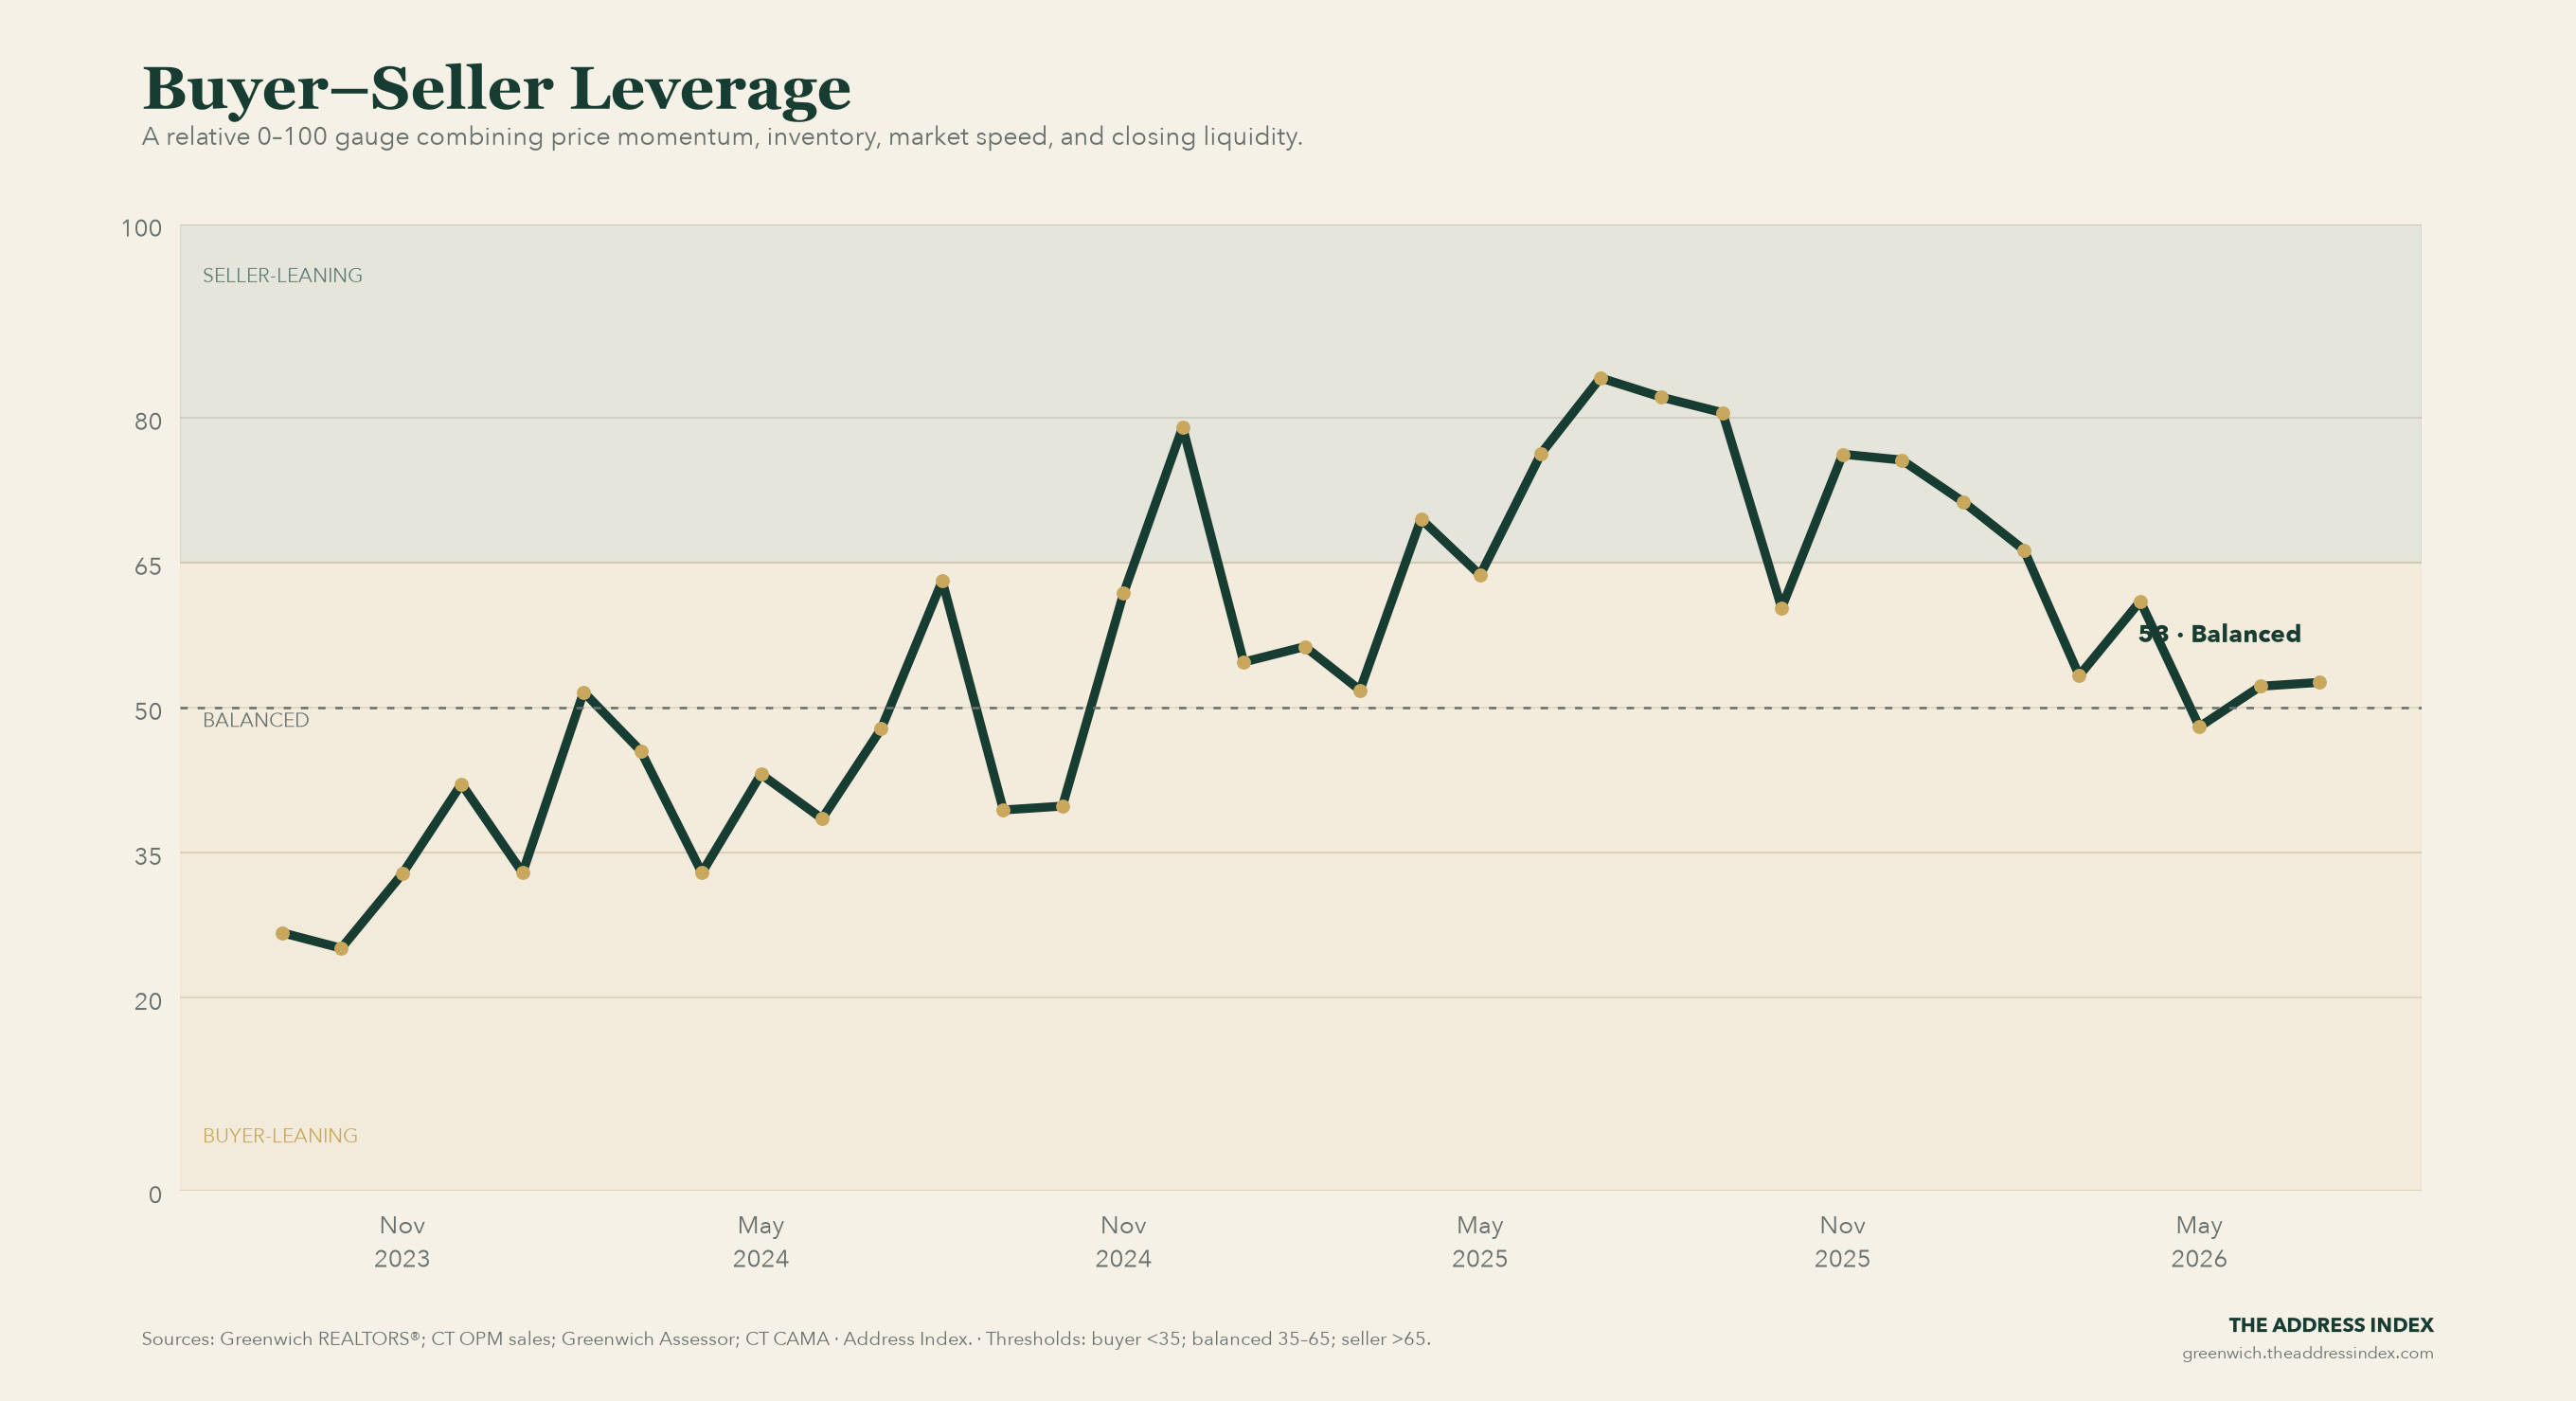
What this chart measures
The leverage index condenses four Greenwich market signals—price momentum, inventory tightness, market speed, and closing liquidity—into one historical balance gauge.
How to read it
Below 35 is buyer-leaning, 35 to 65 is balanced, and above 65 is seller-leaning. The score is relative to Greenwich history and does not predict the negotiation for a particular property.
Why it matters
Buyers, sellers, and brokers need a repeatable way to discuss negotiating conditions. A published composite is more accountable than relying on a single anecdote or headline.
Latest reading: Greenwich's leverage score was 53/100 in July 2026 (balanced). The score ranks four public market signals against the displayed Greenwich history; it is a relative balance gauge, not a forecast.
The Address Index is independent market intelligence based on public and source-linked records. It is not an appraisal, brokerage opinion, or investment recommendation.
Related Greenwich real estate charts
Get The Address Index in your inbox.
The dashboard is public during launch. Paid membership adds the complete weekly analysis, adjusted comparable-sale work, model diagnostics, monthly deep dives, and the archive through Substack.
Subscribe to The Address Index