Understand the market.
Know the property.
The Greenwich research desk: follow the market, investigate an address, and track the public records behind a property decision. Get the latest analysis through The Address Index on Substack.
What changed in Greenwich property, why it matters, and which addresses to watch.
Monthly market evidence through September 2026. Historical sale records through April 23, 2026.
Index revised Sep 19, 2026. The 2026 Q2 Address Index reading was revised from 105.7 (-1.7% YoY, nowcast) to 120.7 (+11.4% YoY, reconstructed).
Newer public parcel sale histories added 447 usable sales and extended the fitted repeat-sales index from 2025 Q3 through 2026 Q2. Quarters after the latest state transaction file (2025 Q3) are now estimated from those reconstructed repeat-sale pairs instead of the monthly-report nowcast, and 2025 Q2 and Q3 were revised up as more pairs were added.
22 Round Hill Club Road: a new filing after a $13M, two-parcel sale
22 Round Hill Club Road: a new filing after a $13M, two-parcel sale
Read the briefing on Substack →Research an address
Parcel facts, past sales, assessment context, and six map checks. Save and compare properties.
Explore recorded sales
Search the historical transaction archive by street, year, price, and property size.
Watch planning activity
Pending applications, board agendas, and minutes, linked to the official records.
The Greenwich market, explained every Thursday
Free subscribers receive previews and selected findings. Paid members get the complete Thursday briefing, property comparisons and dated follow-ups. Public research tools stay free.
Subscribe free for previews · Upgrade for the full Thursday edition. Prefer Substack? Subscribe there instead.
Greenwich Market Dashboard
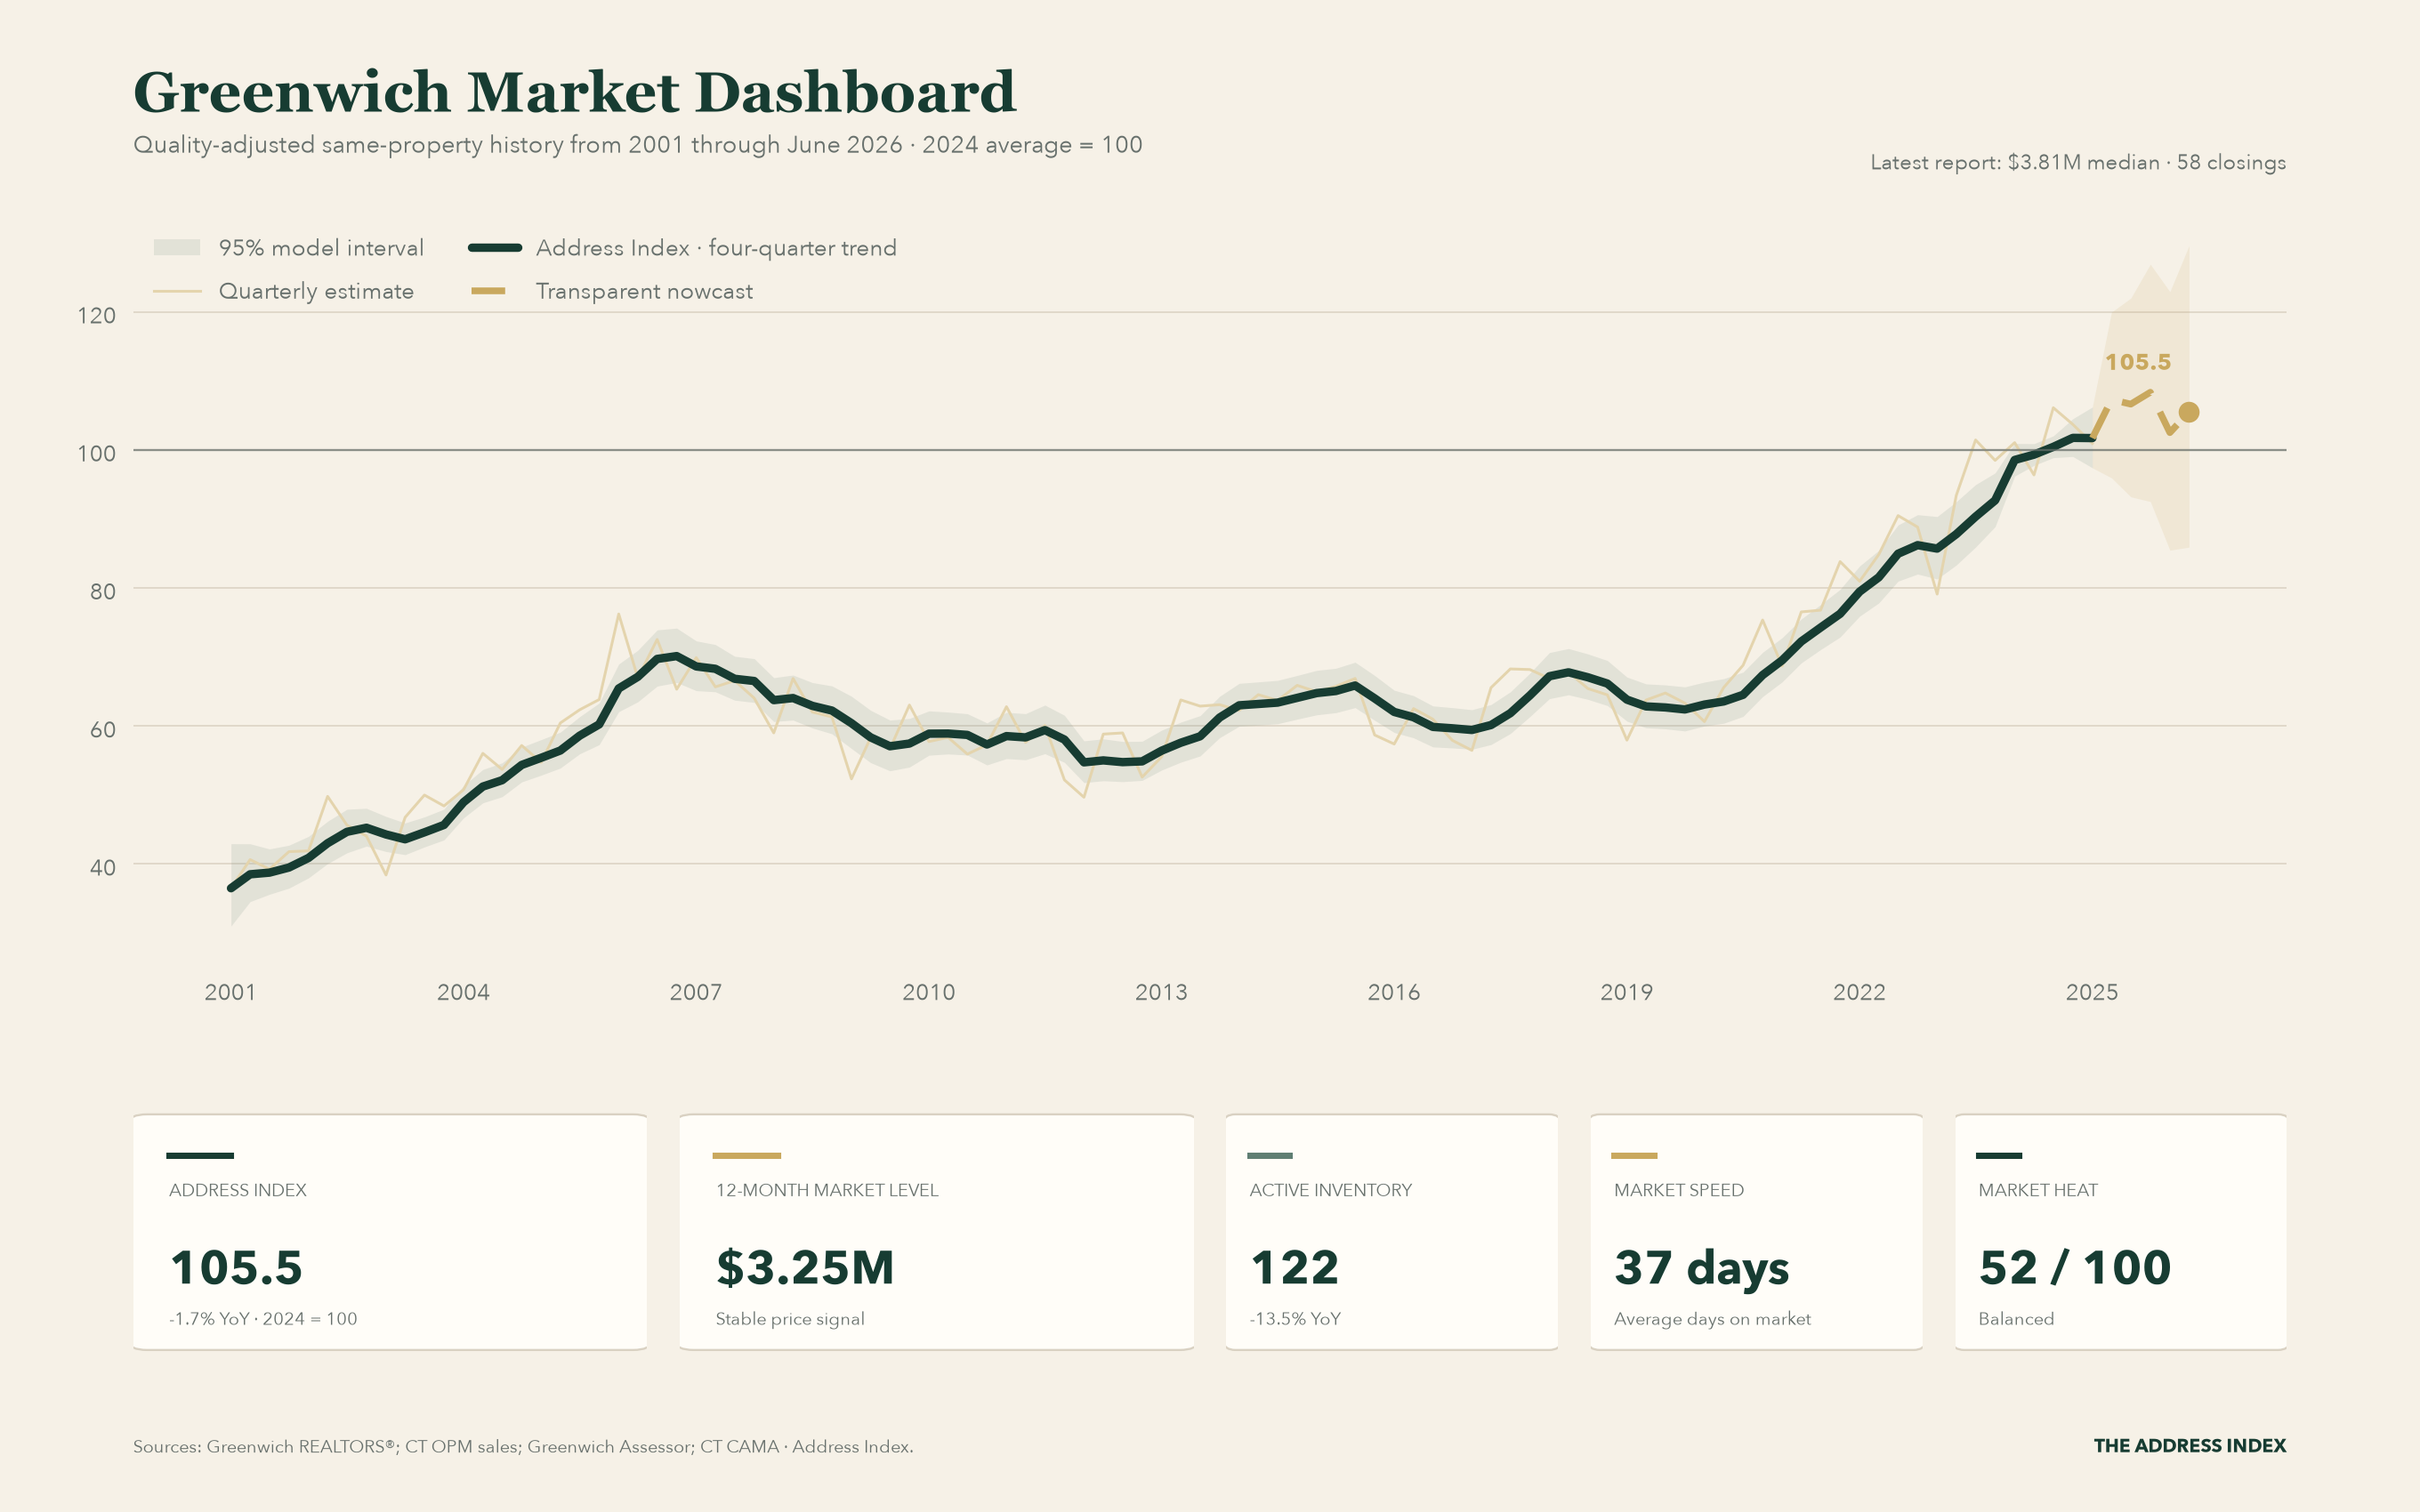
The main view now runs from 2001 to the present. The solid green line is the quality-adjusted Address Index built from repeat sales of the same properties; the dashed gold ending is a transparent nowcast after complete transaction coverage. “Recent” keeps a full year of fitted history visible before the nowcast; use 5Y for a wider current-cycle view.
This month in Greenwich
State sale records for Greenwich stop at the 2025 revaluation, so these three public feeds carry the month: the Town Assessor's official count of valid sales, Redfin's ZIP-code sales tally, and Zillow's home value index. Each one is labeled with its source and the date it was published.
52 valid sales in Sep 2026
Median sale price ÷ 2025 assessed full value (+13.0% vs. October 2025's 1.130). Average ratio 1.317.
Valid residential sales (including condos) per month.
Median sale price divided by the October 1, 2025 revaluation value. 1.00 = sold at assessed full value.
Source: Town of Greenwich Assessor, report to the Board of Estimate & Taxation, 2026-10-19 (covers 10-1-2025 to 9-30-2026). A ratio against assessed value for the homes that sold each month, not a price index.
250 homes sold
Sales-weighted median across 5 ZIP codes (+6.1% YoY) · 25 median days on market · 1.7 months of supply.
Median sale price, rolling three months (ZIP medians weighted by homes sold).
Homes sold, rolling three months ending each month.
Median days on market, rolling three months.
Source: Redfin Data Center, data as of 2026-09-03 · ZIP codes 06807, 06830, 06831, 06870, 06878. Redfin reports ZIP codes over rolling three-month windows; each point covers the three months ending in the month shown. Town counts are sums across ZIP codes. The median sale price and days on market are ZIP medians weighted by homes sold — an approximation, not a recomputed town median.
Typical home value
+13.7% from a year earlier · +11.5% since October 2025.
Zillow Home Value Index for Greenwich, CT, last three years.
| ZIP | ZHVI | YoY |
|---|---|---|
| 06807 | $1.89M | +15.0% |
| 06830 | $2.53M | +13.1% |
| 06831 | $2.17M | +11.7% |
| 06870 | $2.70M | +15.2% |
| 06878 | $2.72M | +14.7% |
Source: Zillow Research, ZHVI All Homes (SFR, Condo/Co-op), smoothed, seasonally adjusted, mid-tier; file published 2026-09-16. A modeled value index for context, not sale prices.
The Assessor's months, latest report
| Month | Valid sales | Median ratio | Average ratio | Above assessed value | Since October 2025 | Revisions |
|---|---|---|---|---|---|---|
| Sep 2026 | 52 | 1.277 | 1.317 | +27.7% | +13.0% | 1 report, unchanged |
| Aug 2026 | 63 | 1.241 | 1.297 | +24.1% | +9.8% | 2 reports, unchanged |
| Jul 2026 | 98 | 1.321 | 1.350 | +32.1% | +16.9% | 2 reports, unchanged |
| Jun 2026 | 65 | 1.293 | 1.330 | +29.3% | +14.4% | 3 reports, unchanged |
| May 2026 | 54 | 1.284 | 1.300 | +28.4% | +13.6% | 4 reports, unchanged |
| Apr 2026 | 46 | 1.218 | 1.236 | +21.8% | +7.8% | 5 reports, unchanged |
| Mar 2026 | 40 | 1.202 | 1.247 | +20.2% | +6.4% | 40 sales / 1.213 (2026-04-21) → 40 sales / 1.202 (2026-05-18) |
| Feb 2026 | 27 | 1.142 | 1.170 | +14.2% | +1.1% | 26 sales / 1.139 (2026-03-23) → 27 sales / 1.142 (2026-05-18) |
| Jan 2026 | 44 | 1.123 | 1.183 | +12.3% | -0.6% | 40 sales / 1.209 (2026-02-24) → 44 sales / 1.123 (2026-05-18) |
| Dec 2025 | 63 | 1.146 | 1.179 | +14.6% | +1.4% | 58 sales / 1.175 (2026-01-20) → 63 sales / 1.146 (2026-05-18) |
| Nov 2025 | 53 | 1.188 | 1.203 | +18.8% | +5.1% | 54 sales / 1.202 (2026-01-20) → 53 sales / 1.188 (2026-05-18) |
| Oct 2025 | 55 | 1.130 | 1.159 | +13.0% | +0.0% | 45 sales / 1.138 (2026-01-20) → 55 sales / 1.130 (2026-05-18) |
“Above assessed value” is the median ratio minus one. “Since October 2025” divides each month's median ratio by October 2025's (1.130), because homes were already selling above the new values when they took effect. Both describe the homes that sold that month; a different mix of homes sells every month. Counts are revised in later reports; this table shows the latest report and every earlier value that changed.
Synthetic Twin
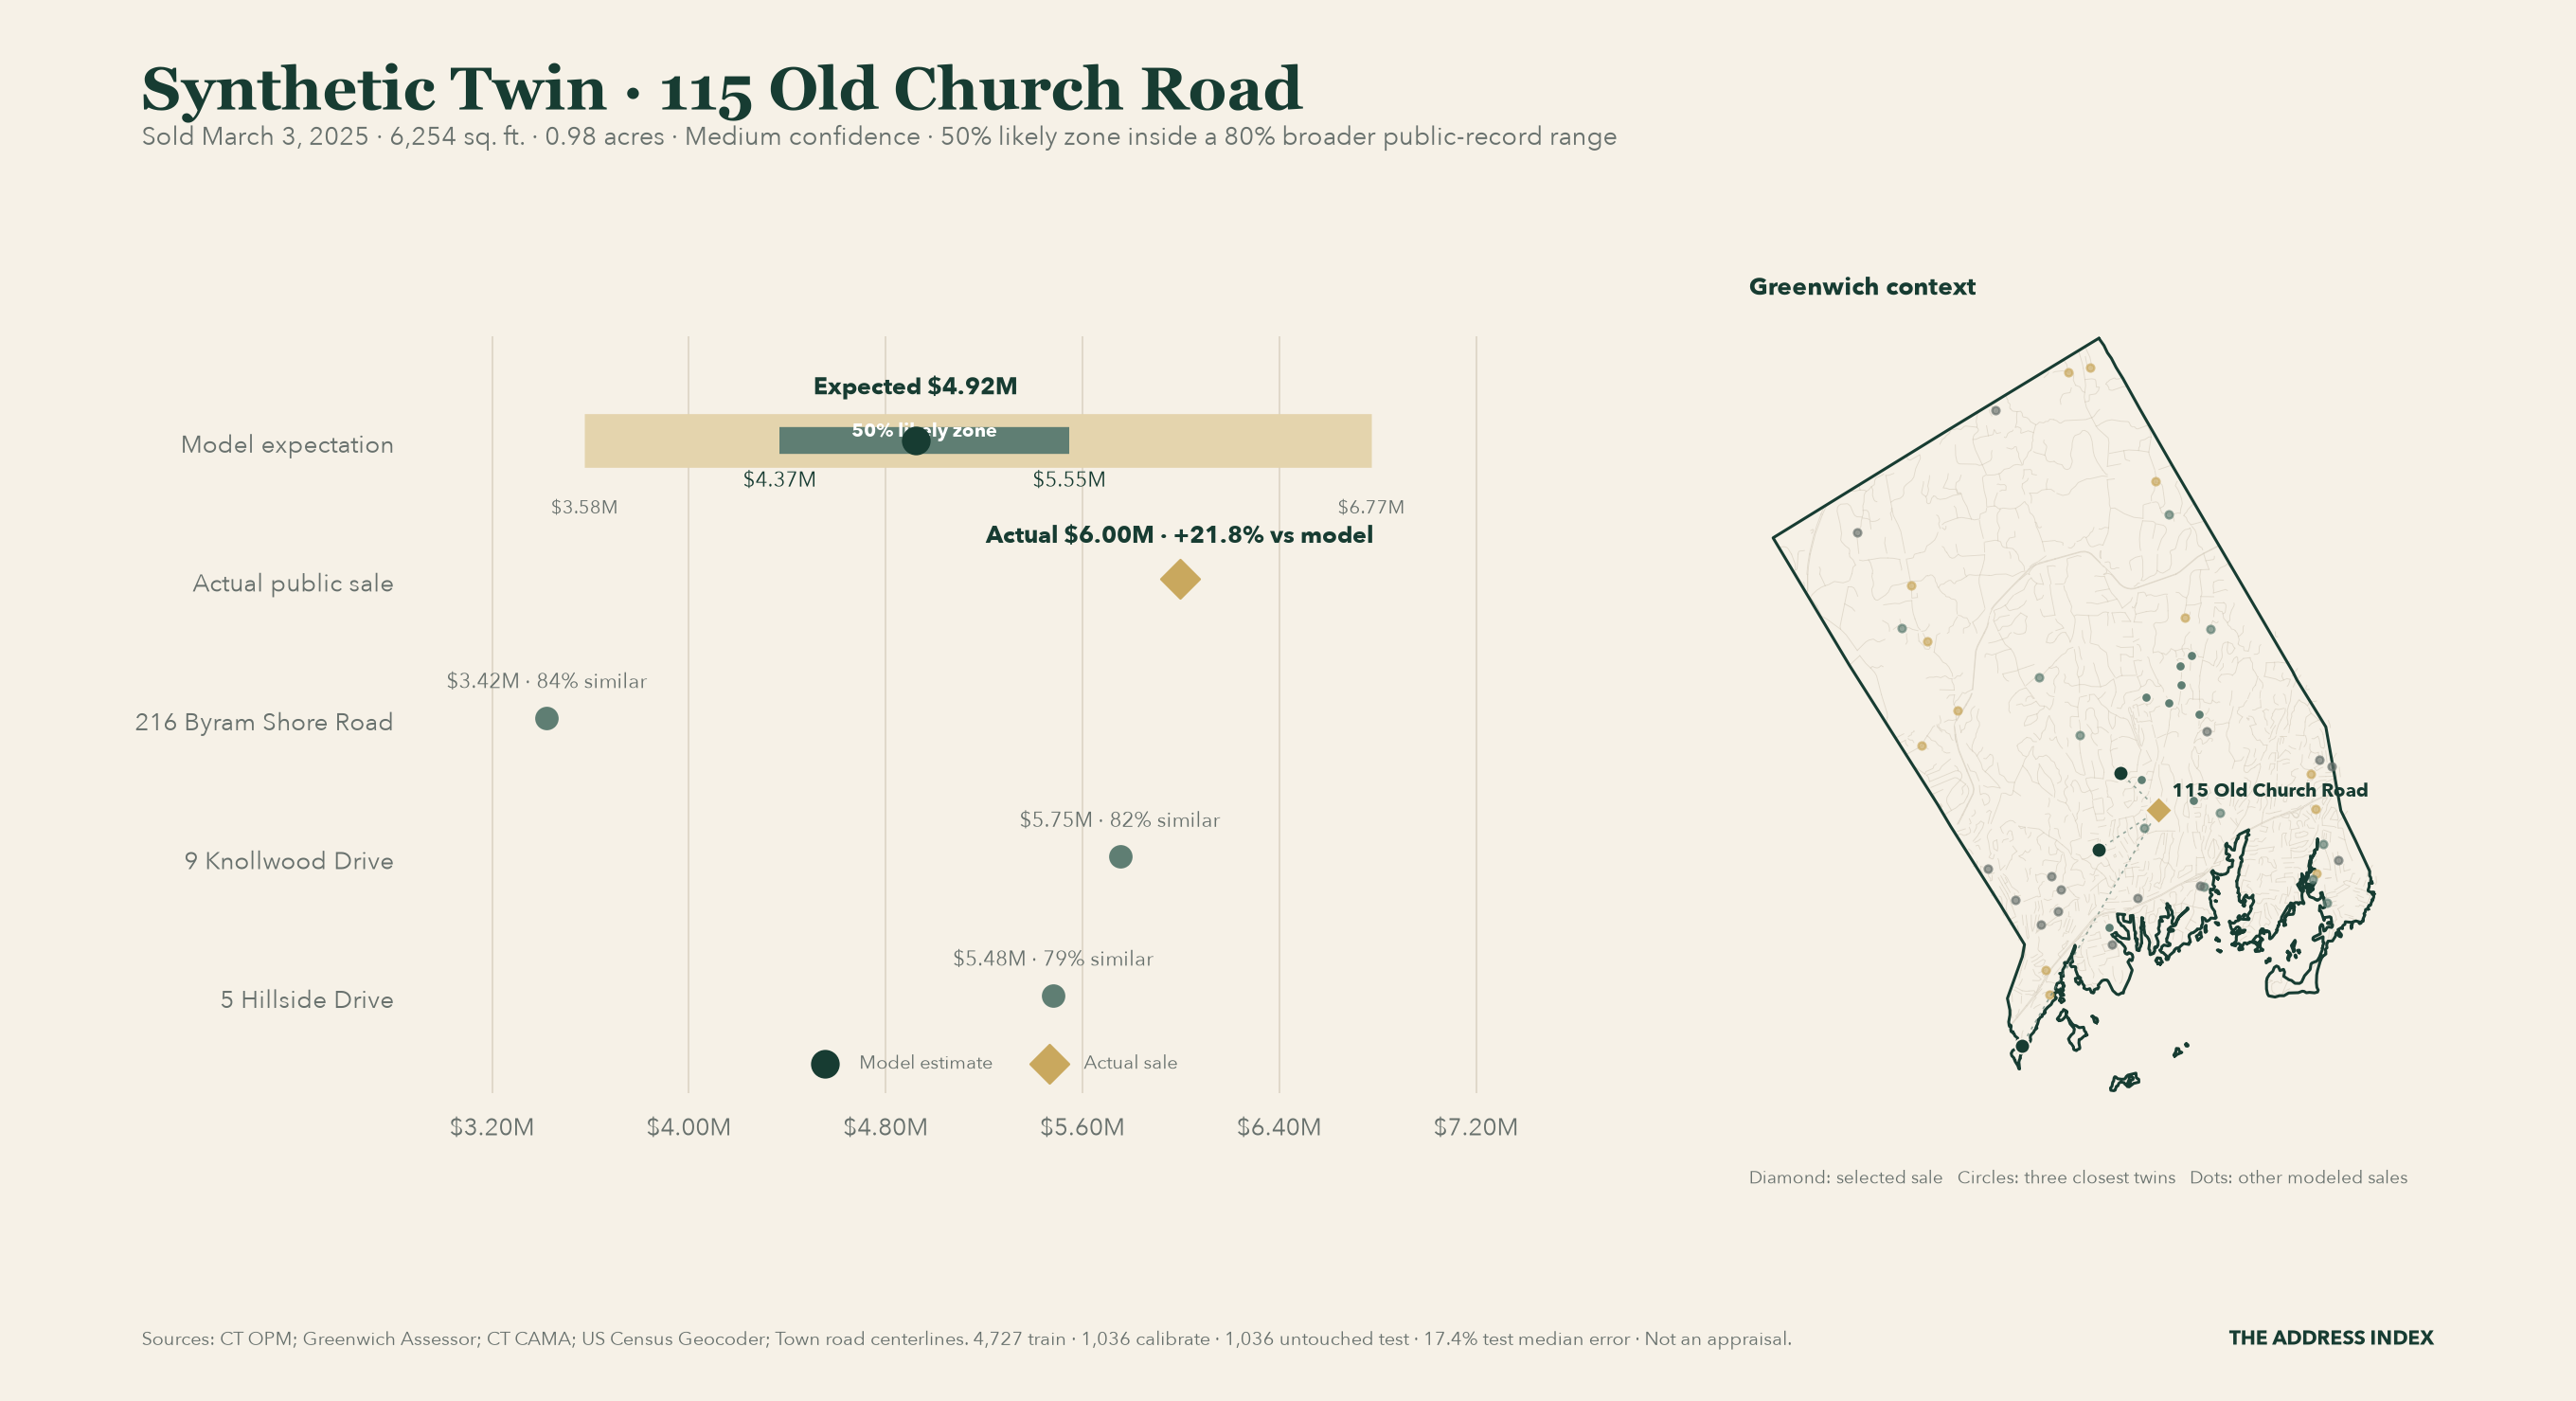
Choose a completed sale to inspect its out-of-sample model expectation, a tighter likely zone, broader uncertainty, the public facts behind it, and where its earlier twins sit across Greenwich.
Synthetic Twin · 36 Baldwin Farms North
36 Baldwin Farms North sold for $7.75M, 35.4% below its $12.0M out-of-sample expectation. Its 50% likely zone is $9.88M–$14.6M; the 80% broader range is $8.20M–$17.6M. The model used 2,289 training, 501 calibration, and 501 untouched test sales; test median error was 22.4%. This is a market comparison, not an appraisal.
Get the complete Greenwich briefing.
Every Thursday: the important developments, the evidence behind them, and what they mean for a property decision.
- Property case studies: earlier plans, new decisions, and what actually changed.
- Dated follow-ups: new evidence on addresses we have covered, with open questions clearly marked.
- Market context and the paid archive: State of Greenwich analysis when new monthly reports arrive, plus every full edition.
The research desk is public during launch. Free subscribers receive previews and selected findings; paid members receive the complete analysis on Substack.
Price, leverage, liquidity, and the long view
The Same House Test · Greenwich
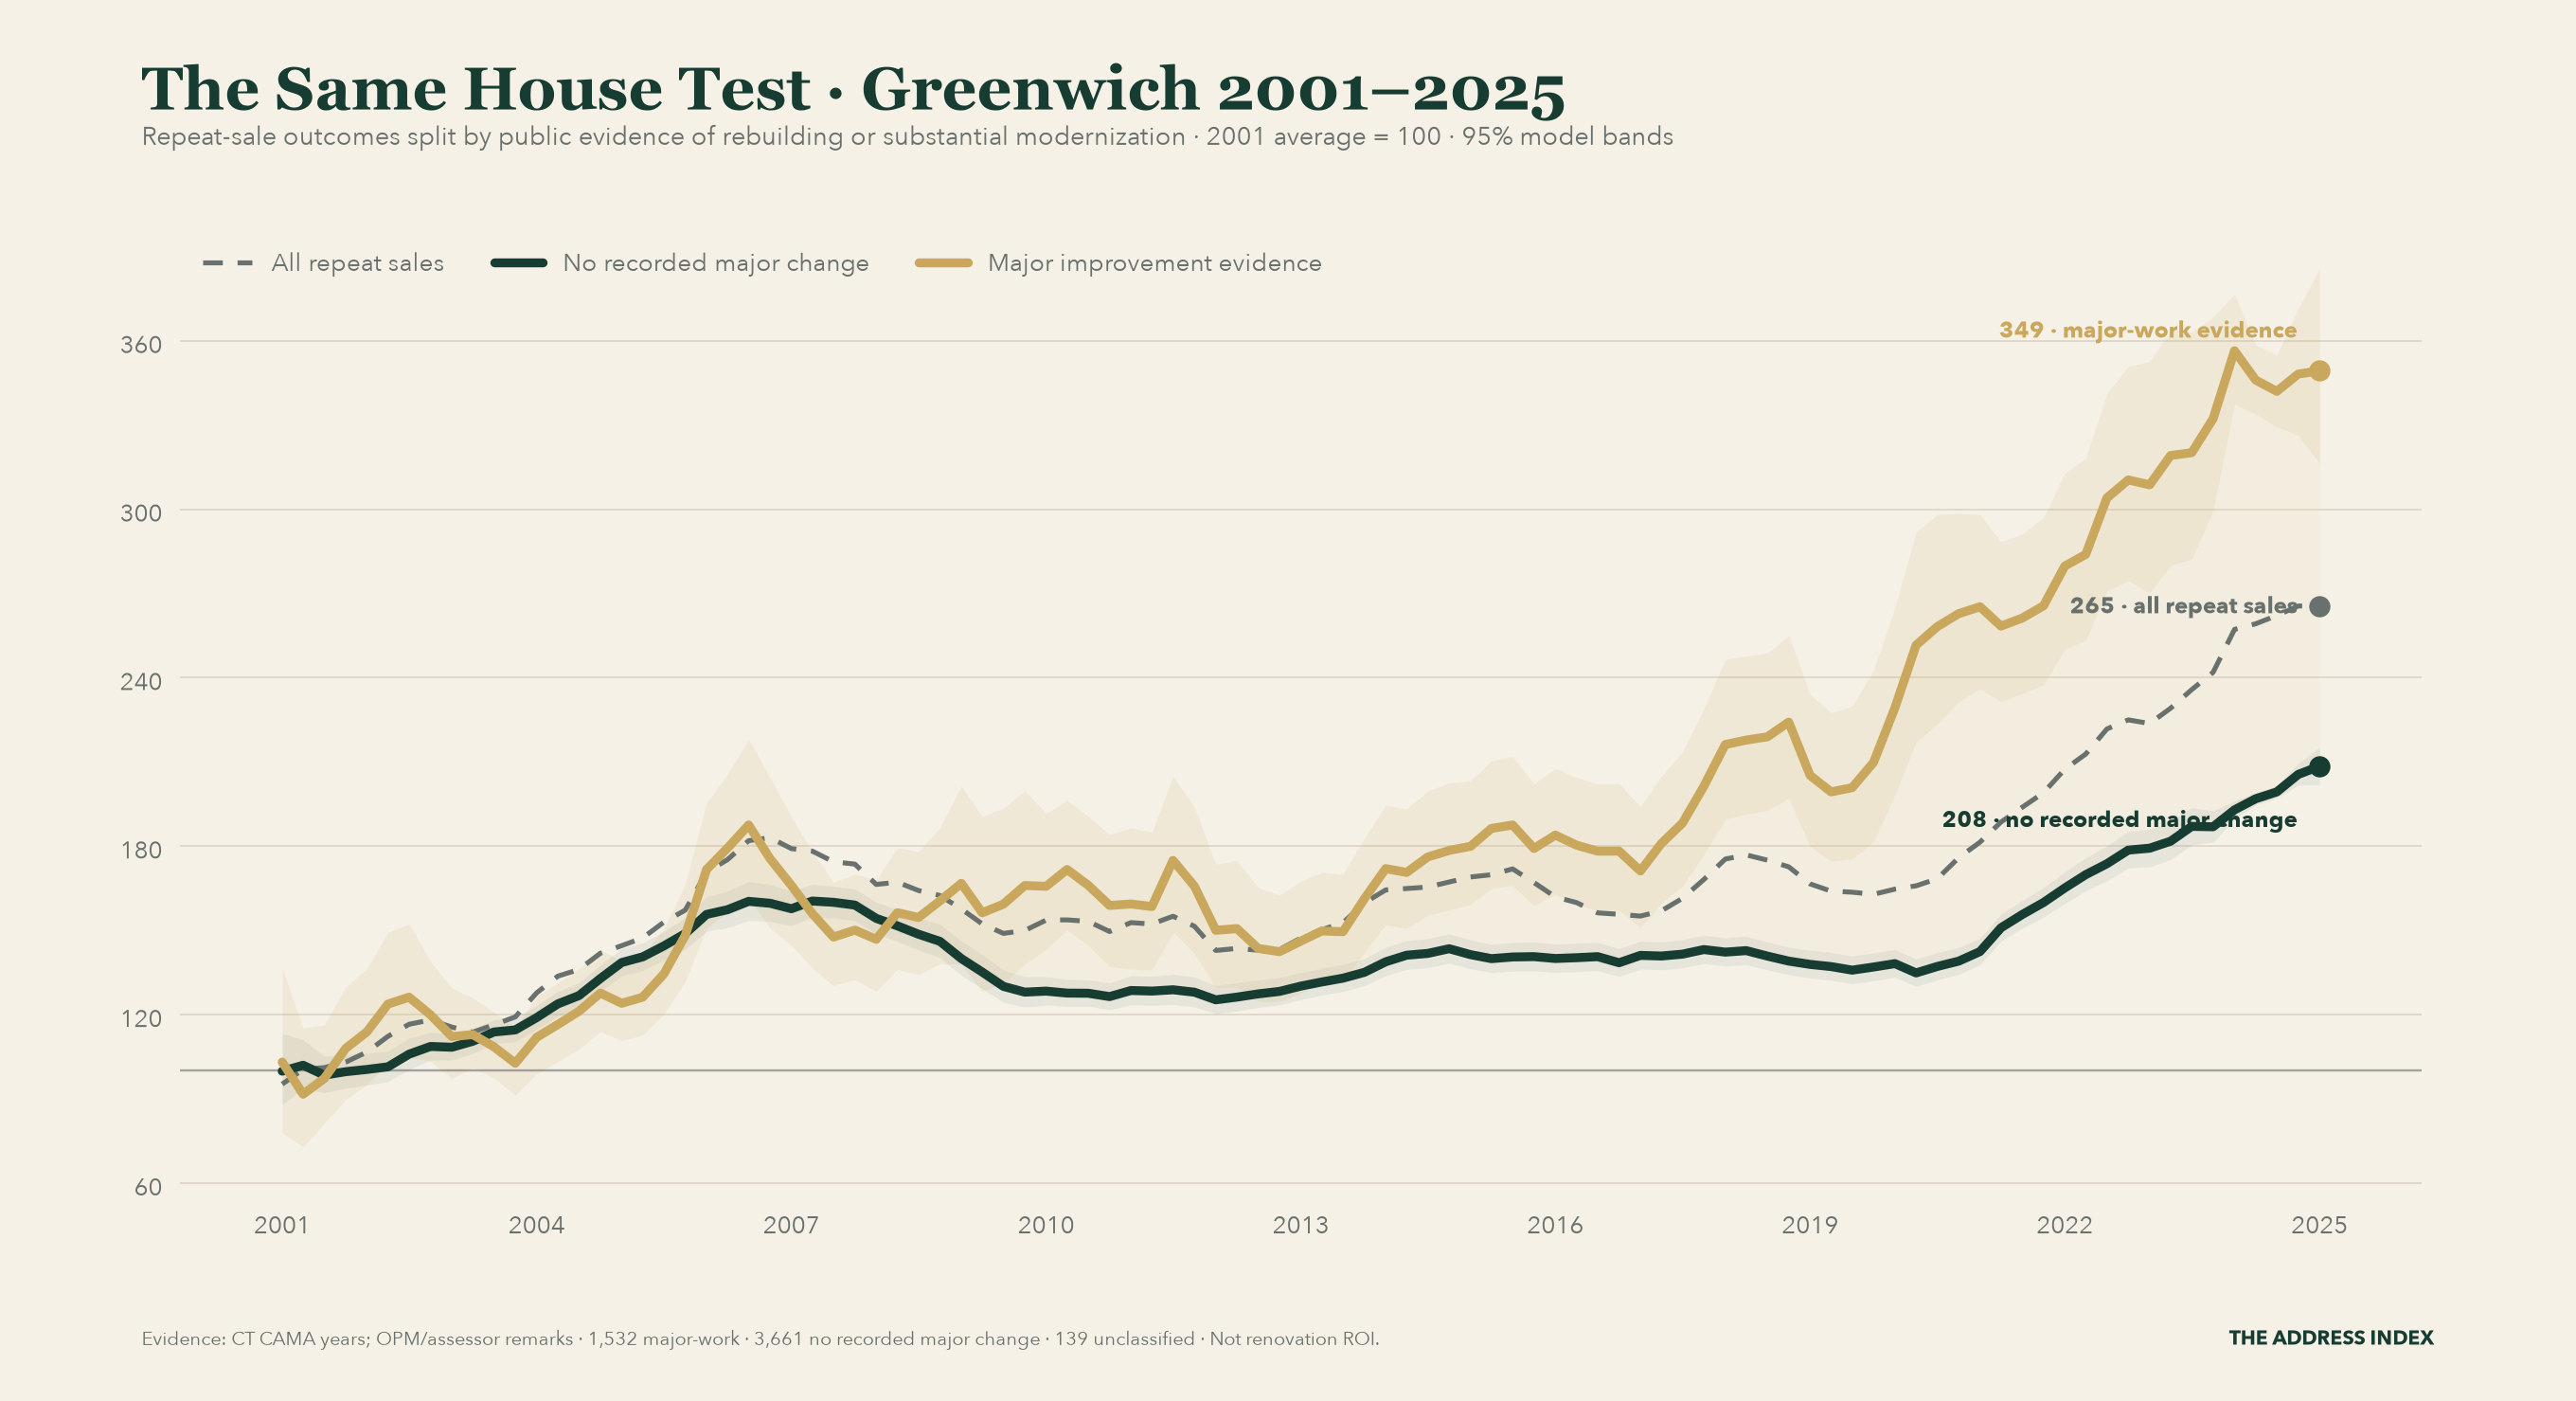
Among eligible repeat-sale intervals, 1,690 carry public evidence of rebuilding or substantial modernization and 3,847 have no recorded major change. Since the 2001 base, their modeled resale paths reached 323 and 239, respectively, versus 304 for all repeat sales. This is an evidence split, not a renovation-return estimate.
Greenwich Market Level · Monthly Reports
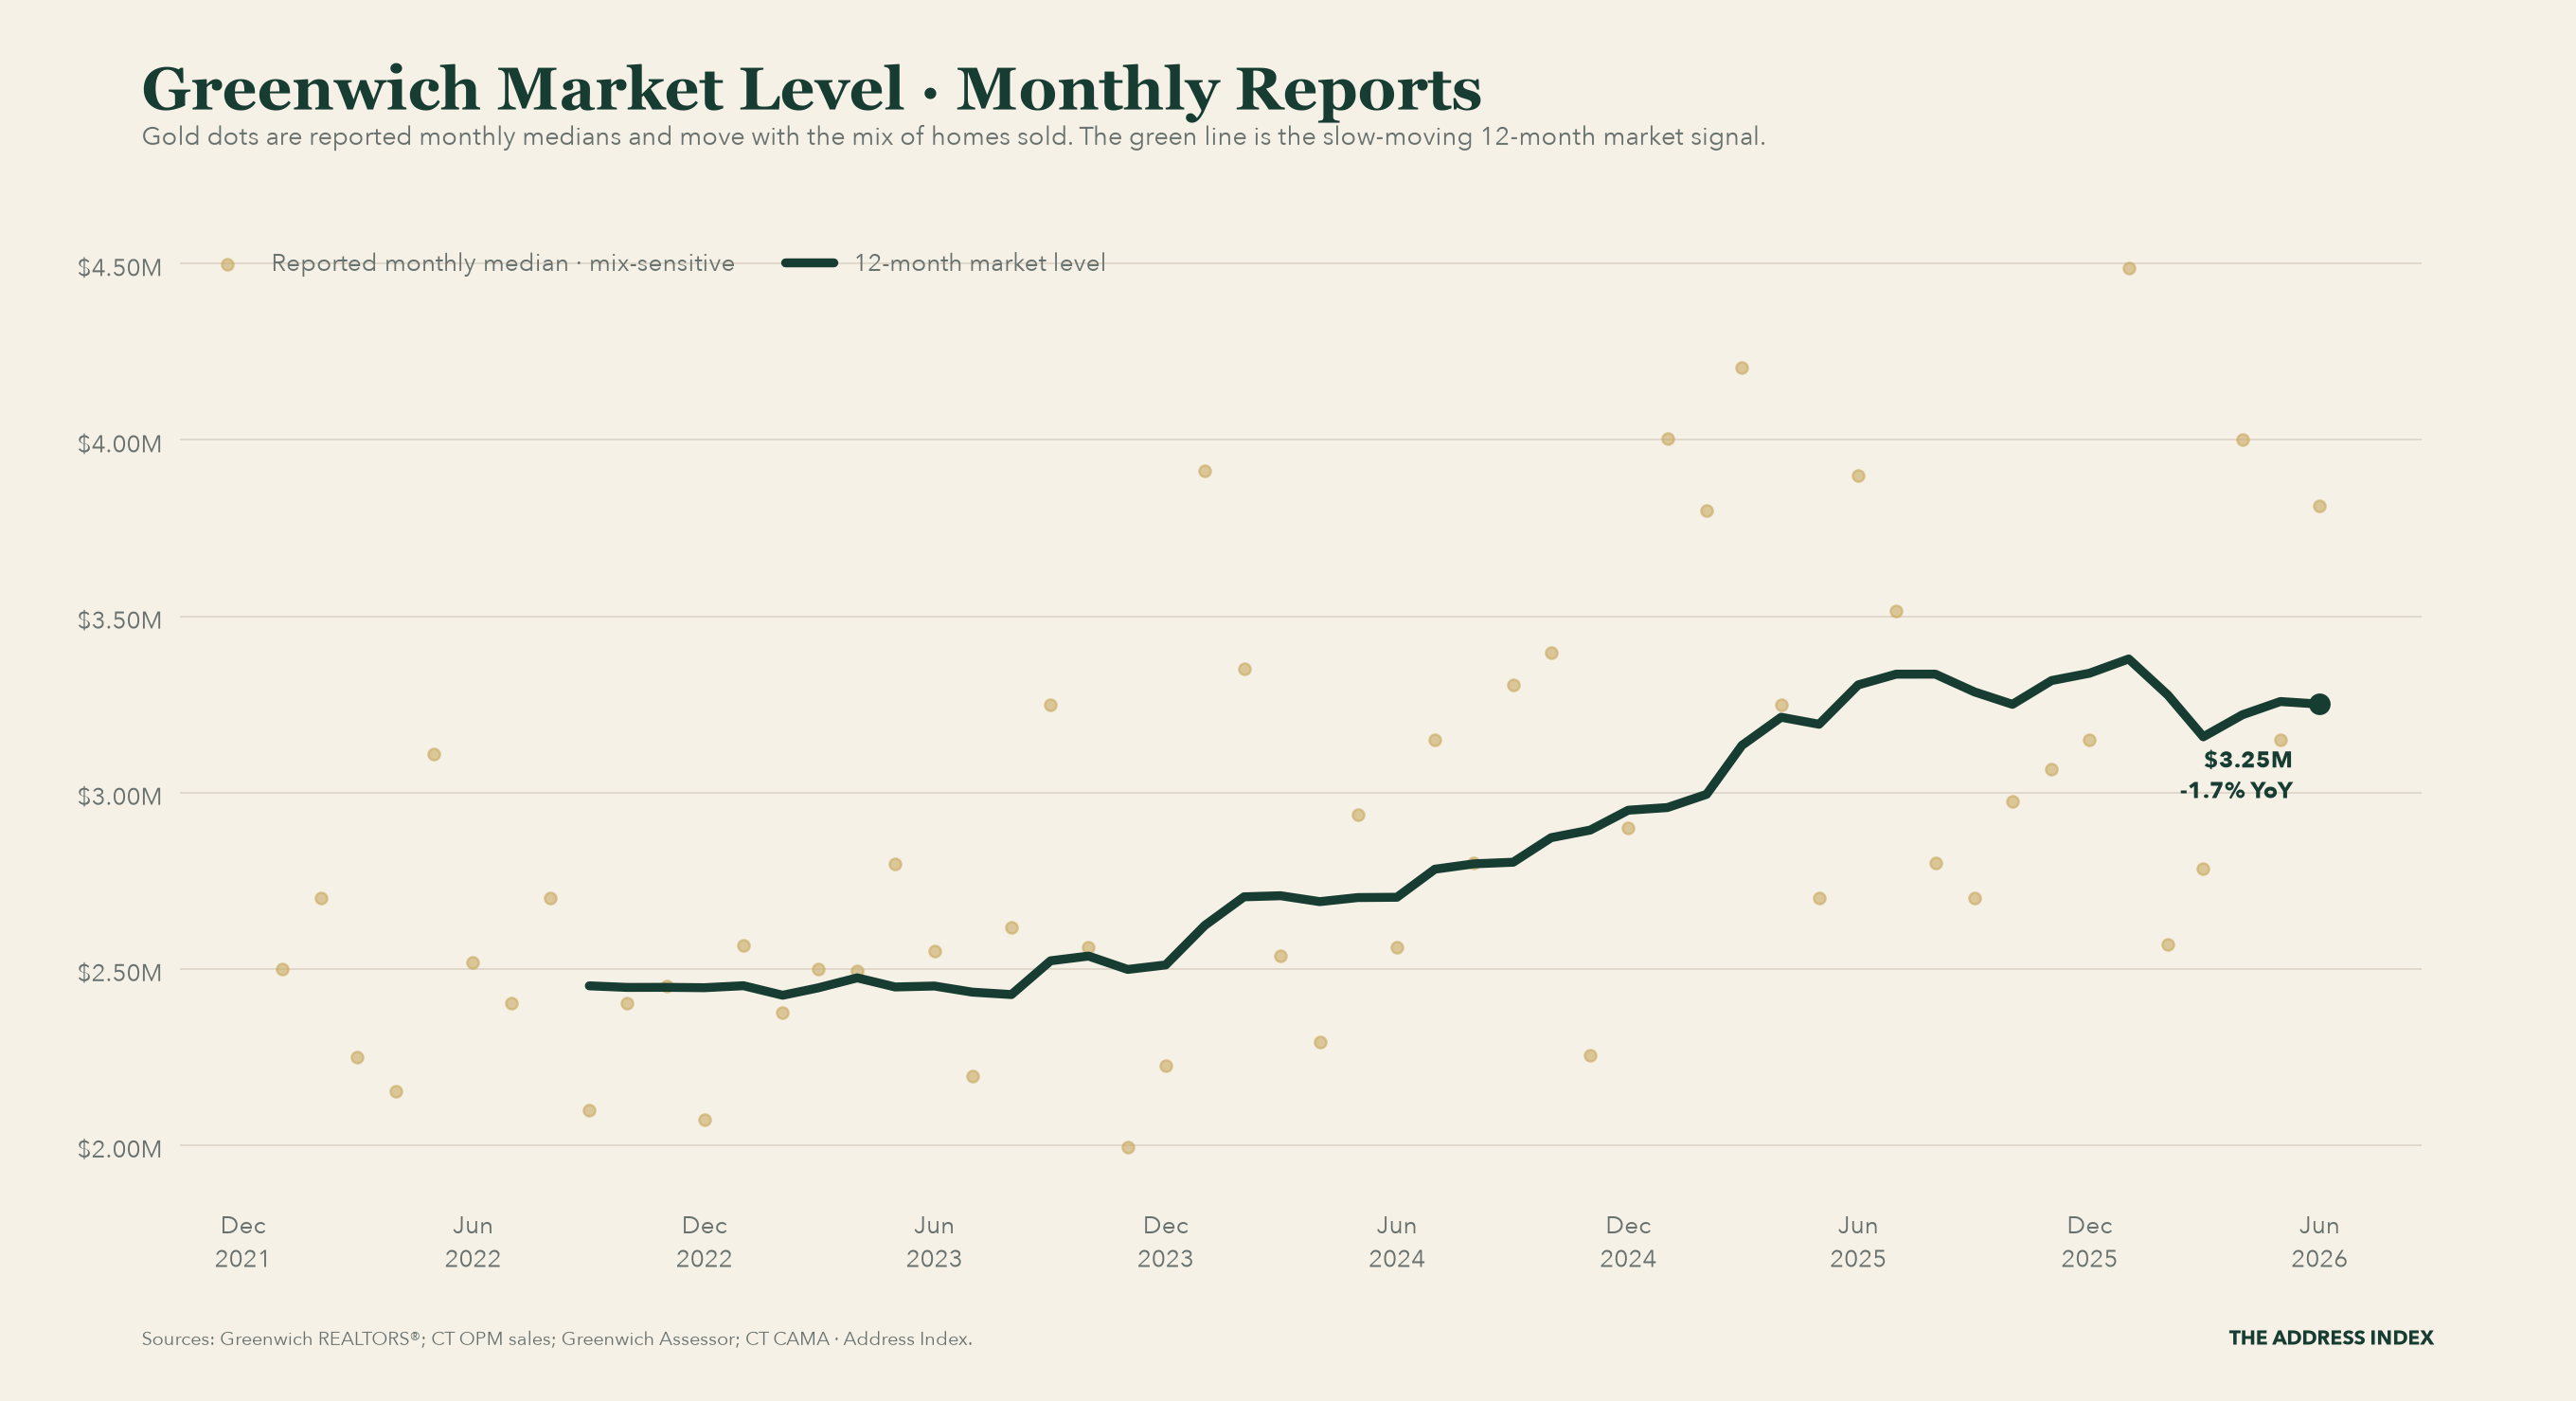
The Greenwich 12-month market level was $3.37M in September 2026, +2.7% from a year earlier. Monthly medians are shown as mix-sensitive context, not connected as a trend.
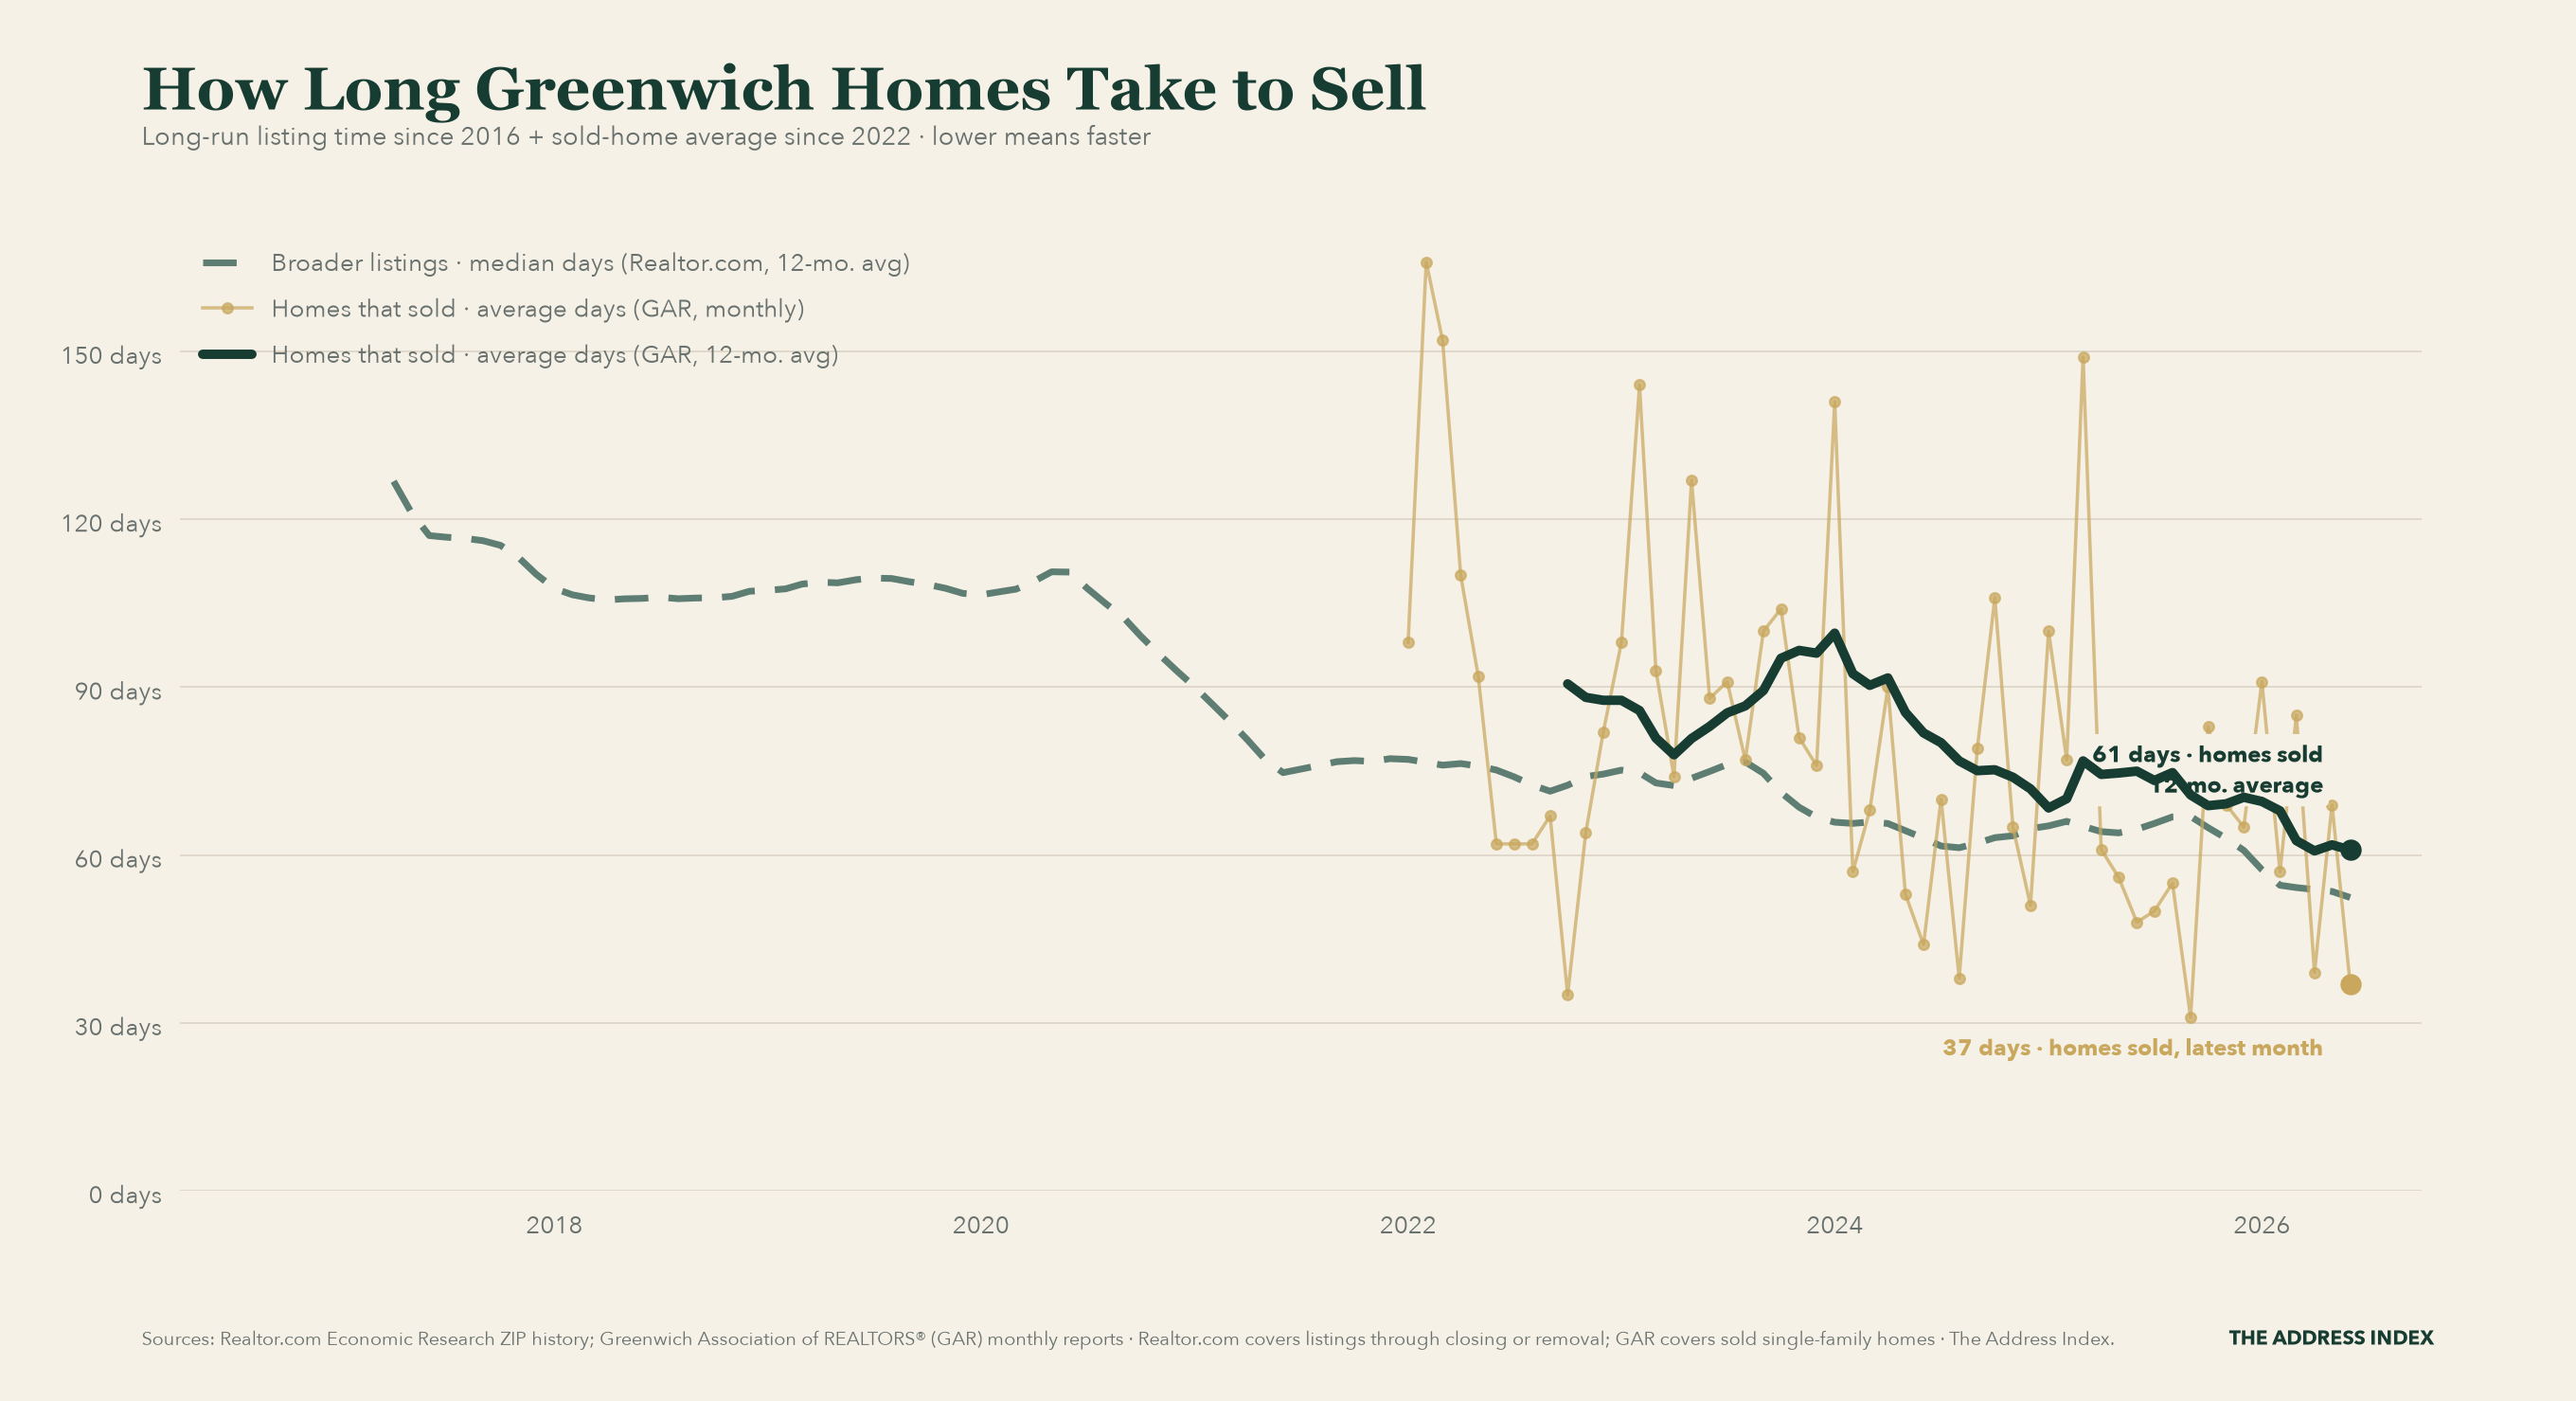
How Long Greenwich Homes Take to Sell
Greenwich single-family homes averaged 40 days on market in September 2026, versus 31 a year earlier. The trailing 12-month average was 57 days. A separate Realtor.com ZIP composite extends the directional history to July 2016; it measures median listing time, not GAR's average for sold homes. Its latest 12-month average was 49 days, versus 67 a year earlier.
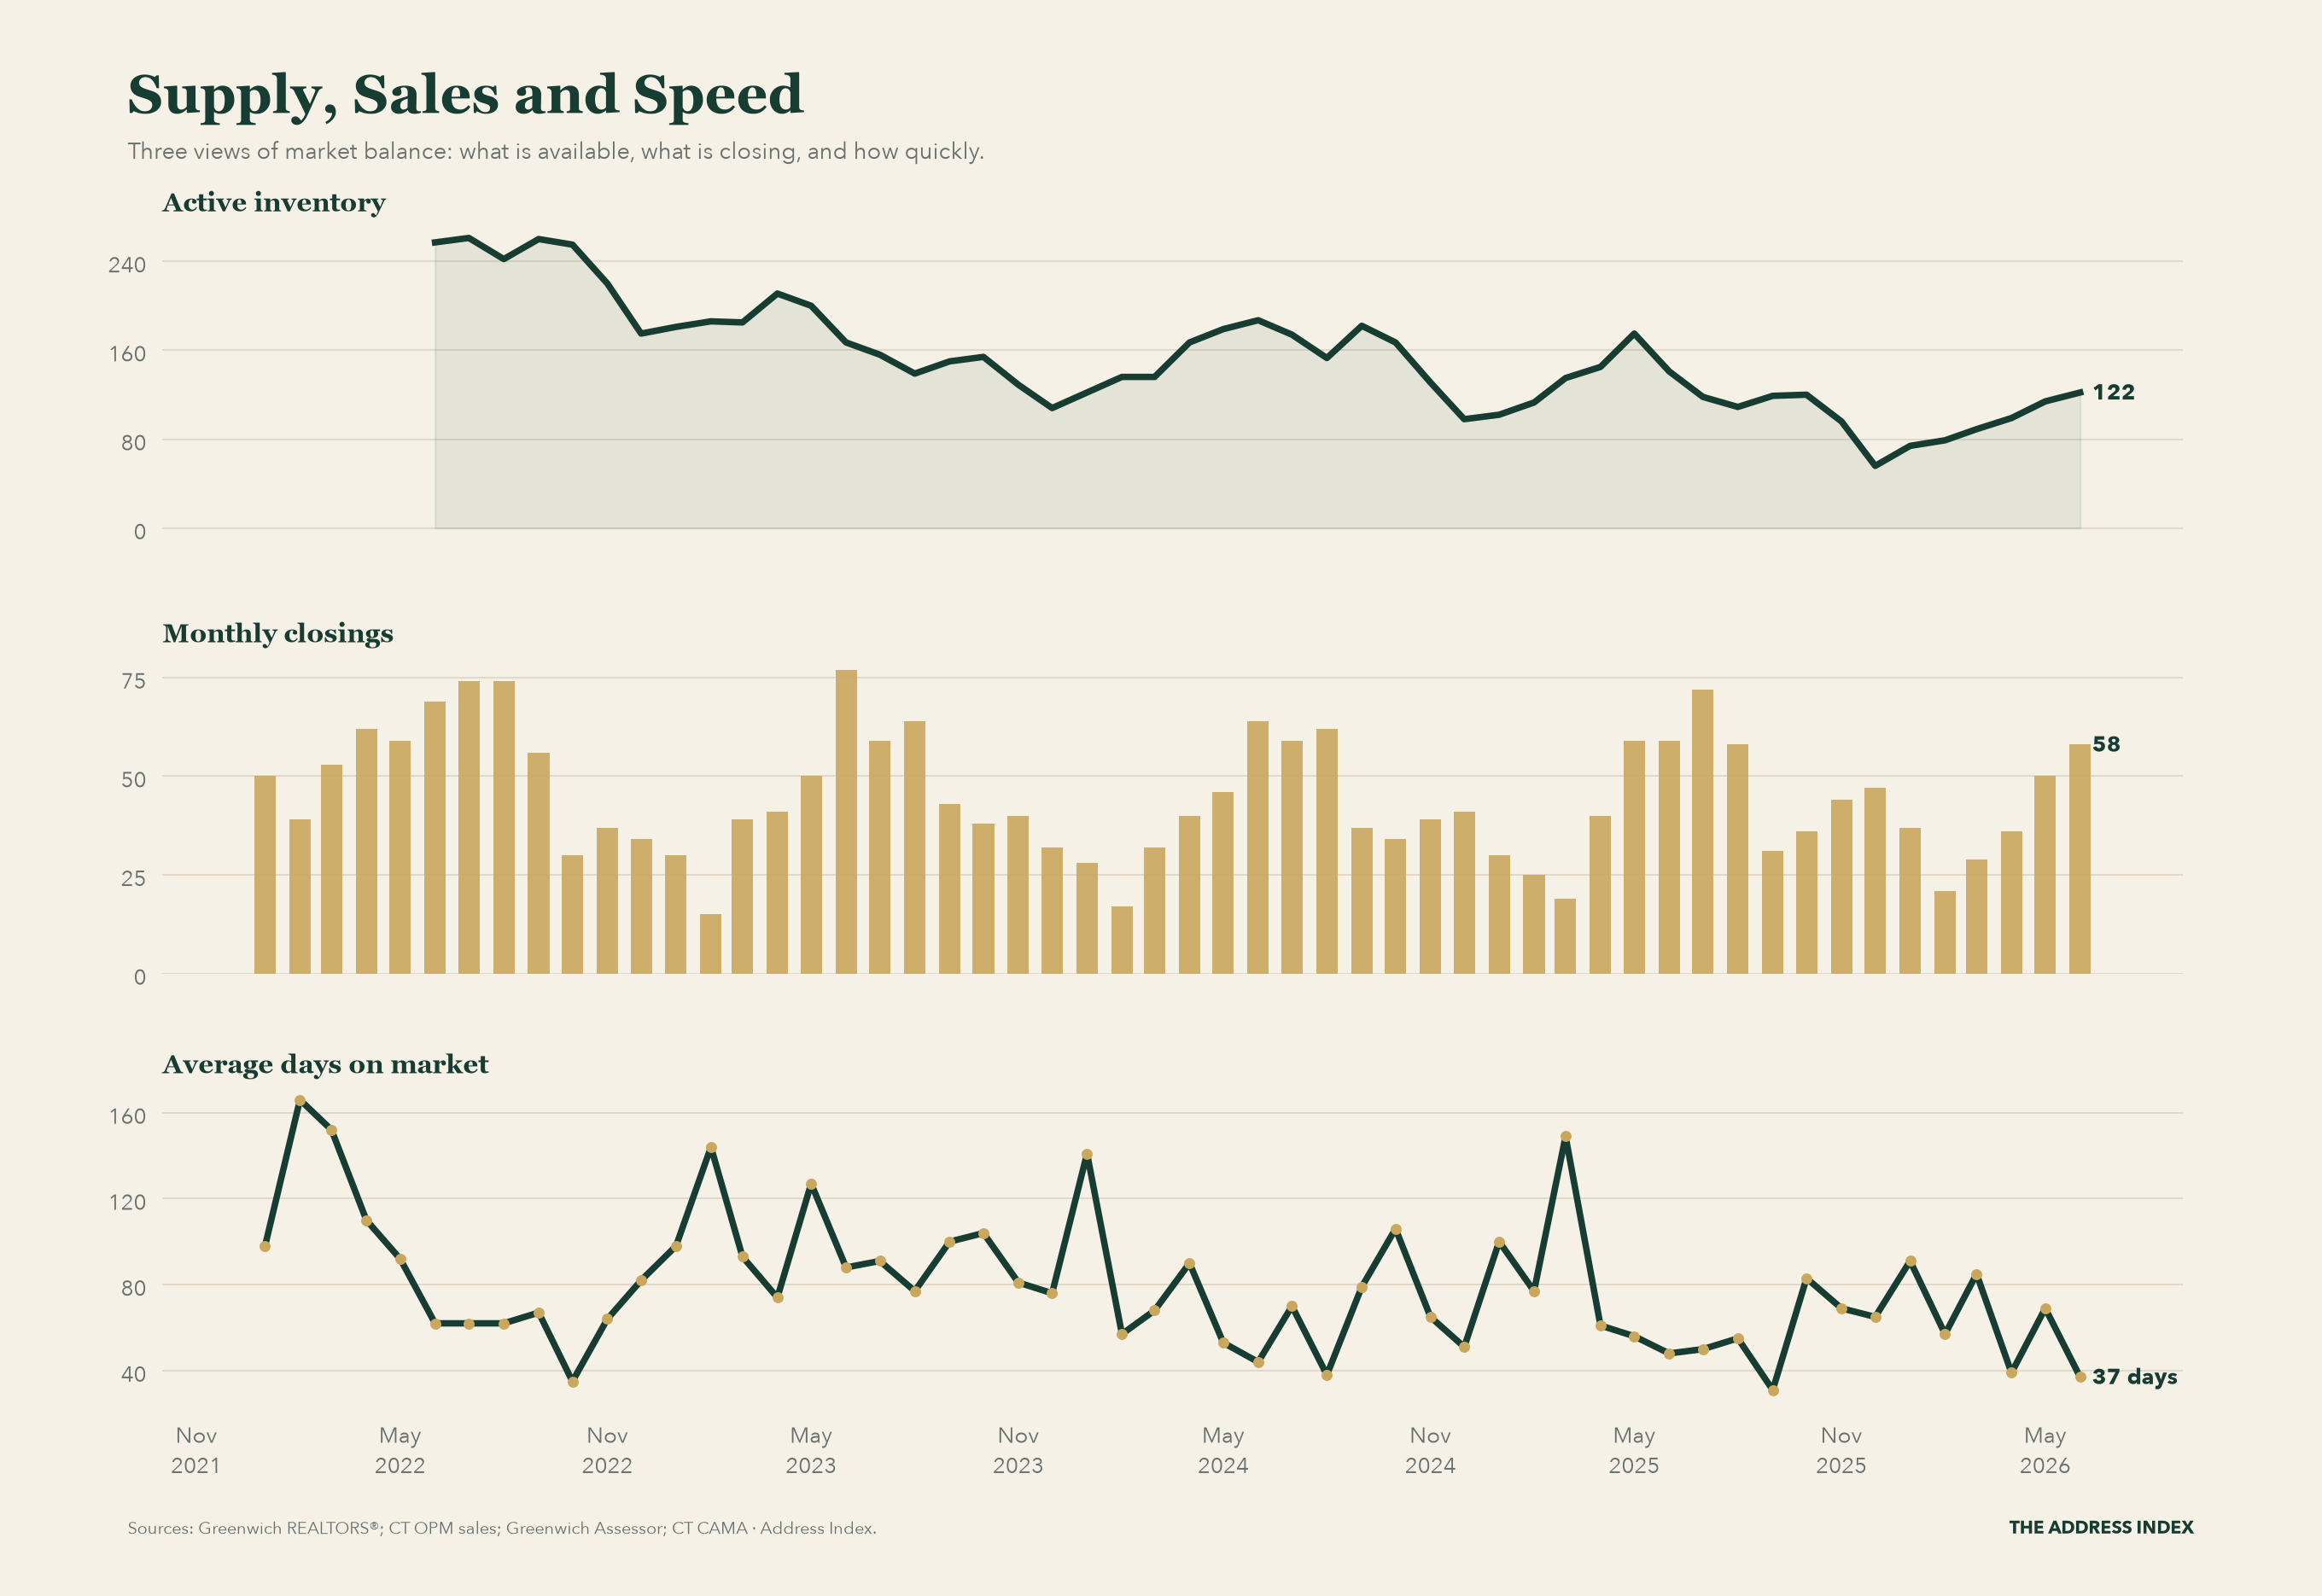
Supply, Sales and Speed
Greenwich ended September 2026 with 124 active single-family homes, 38 closings, and an average 40 days on market.
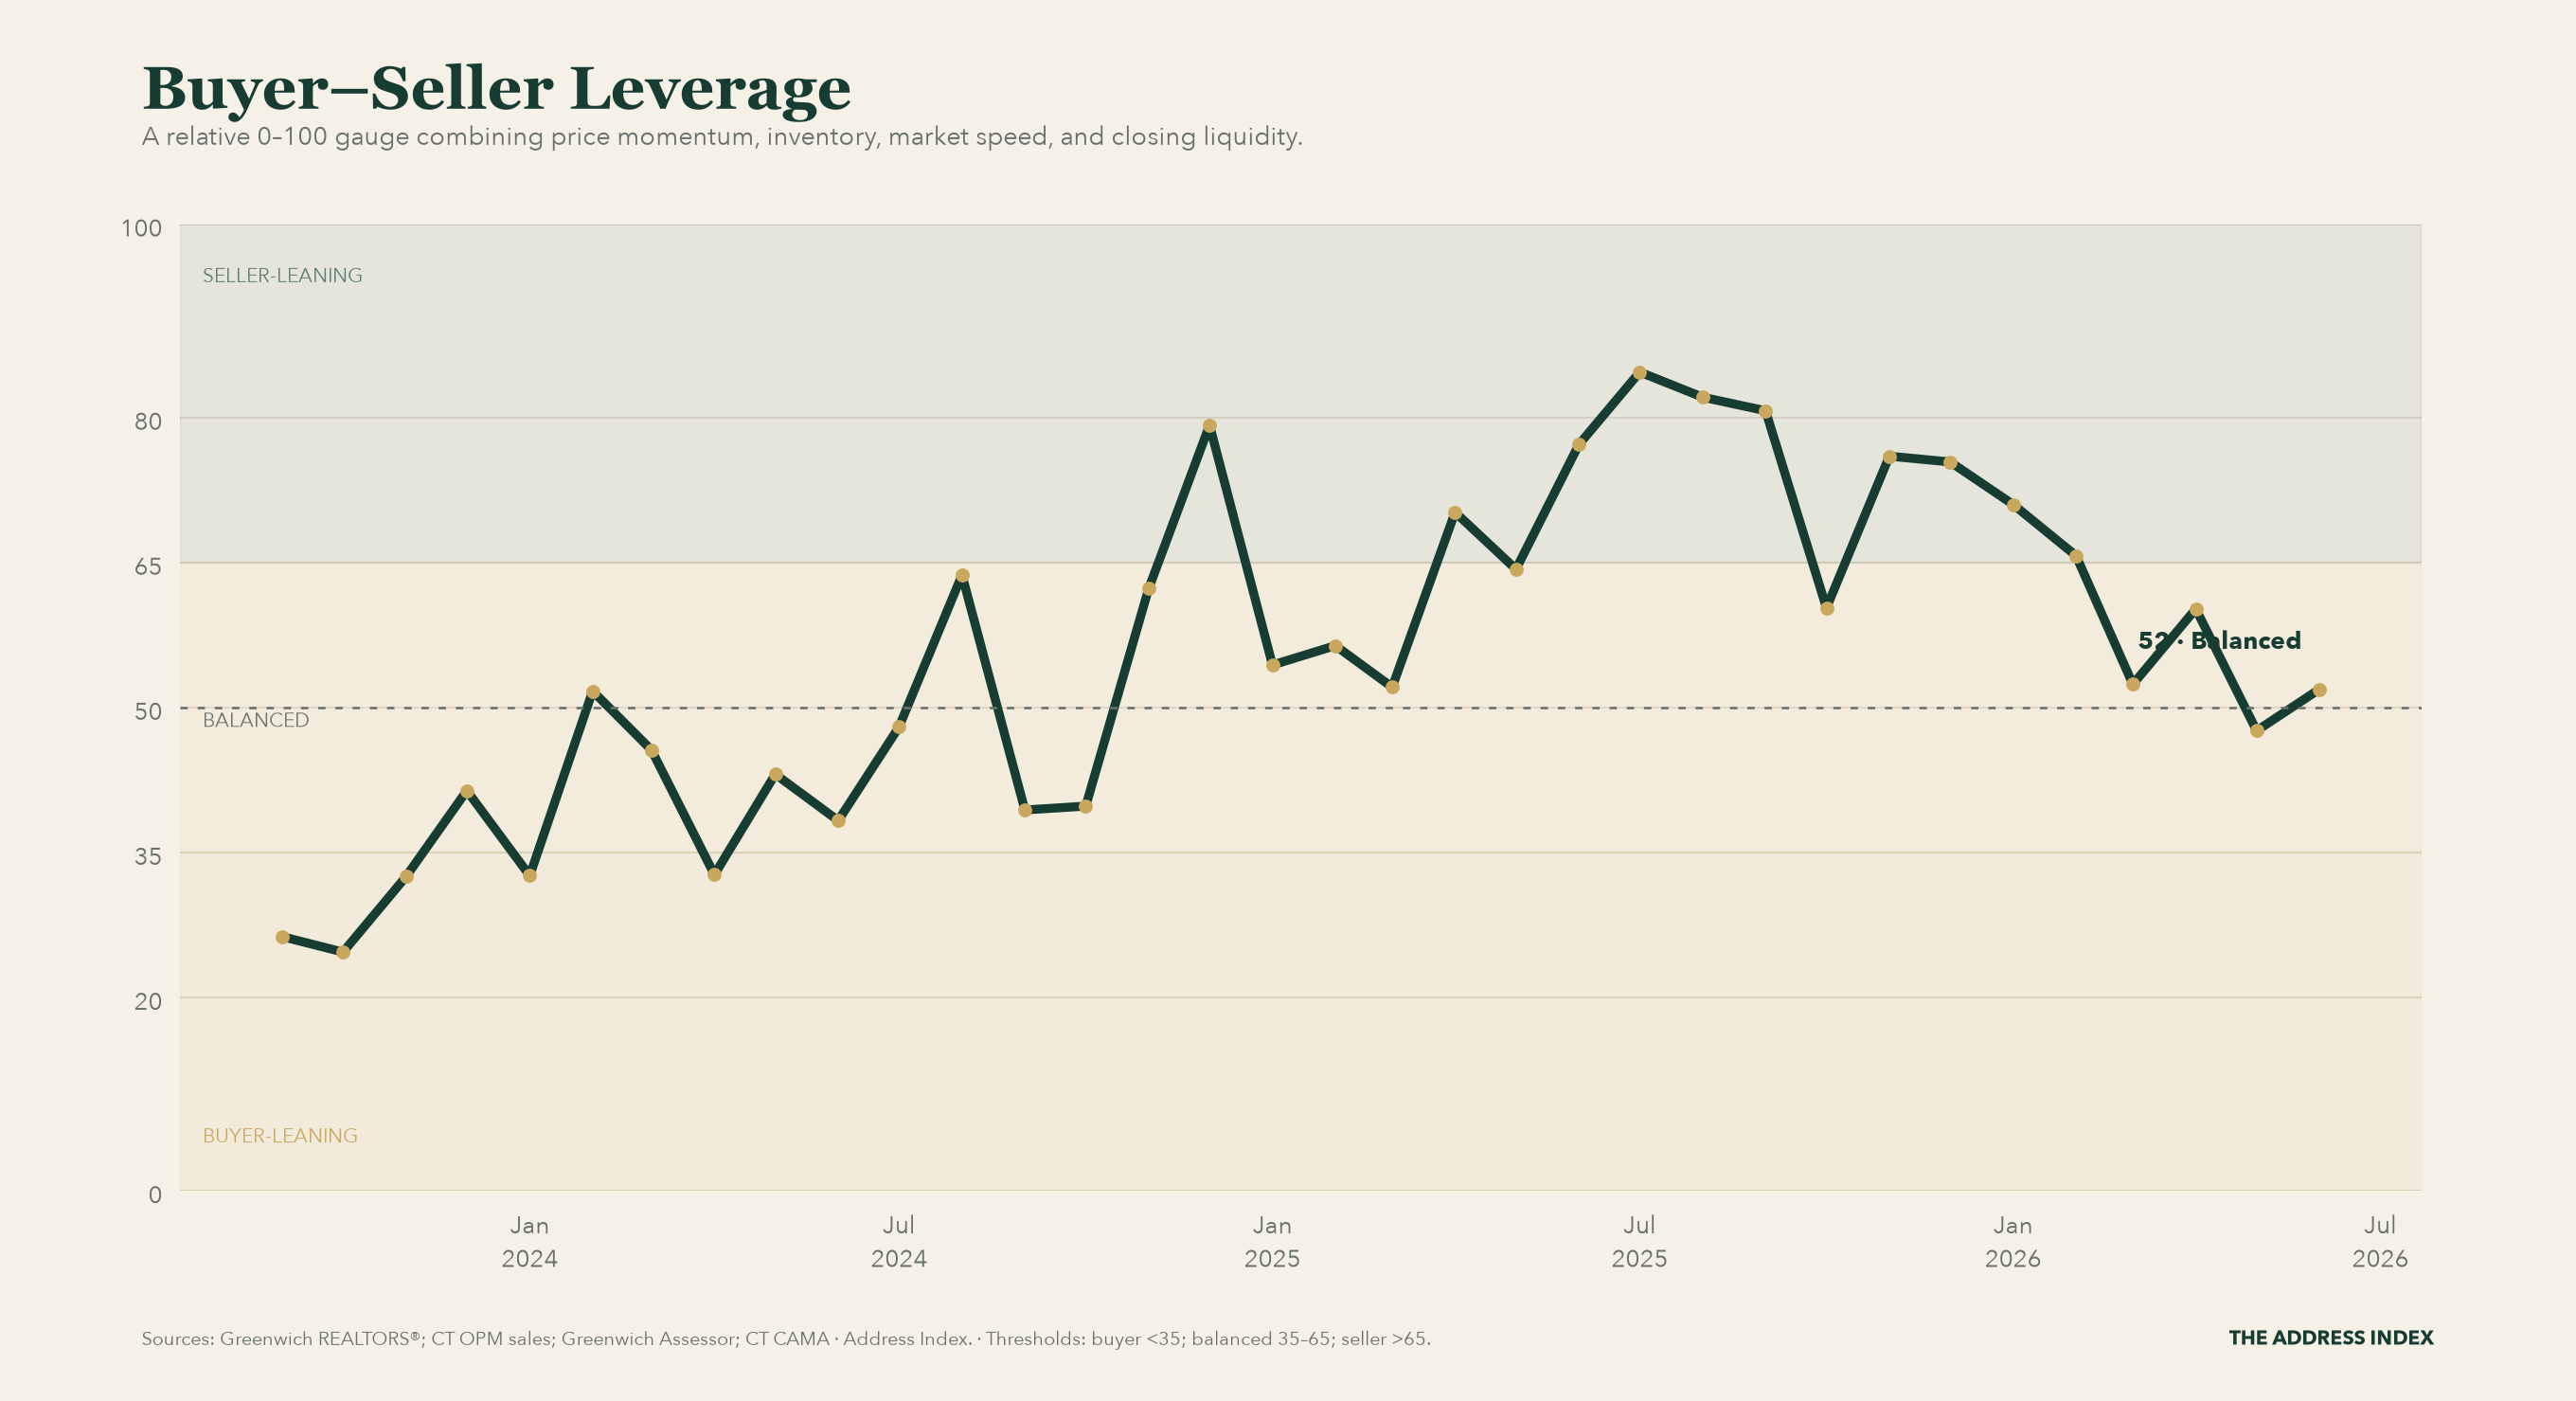
Buyer–Seller Leverage
Greenwich's leverage score was 53/100 in September 2026 (balanced). The score ranks four public market signals against the displayed Greenwich history; it is a relative balance gauge, not a forecast.
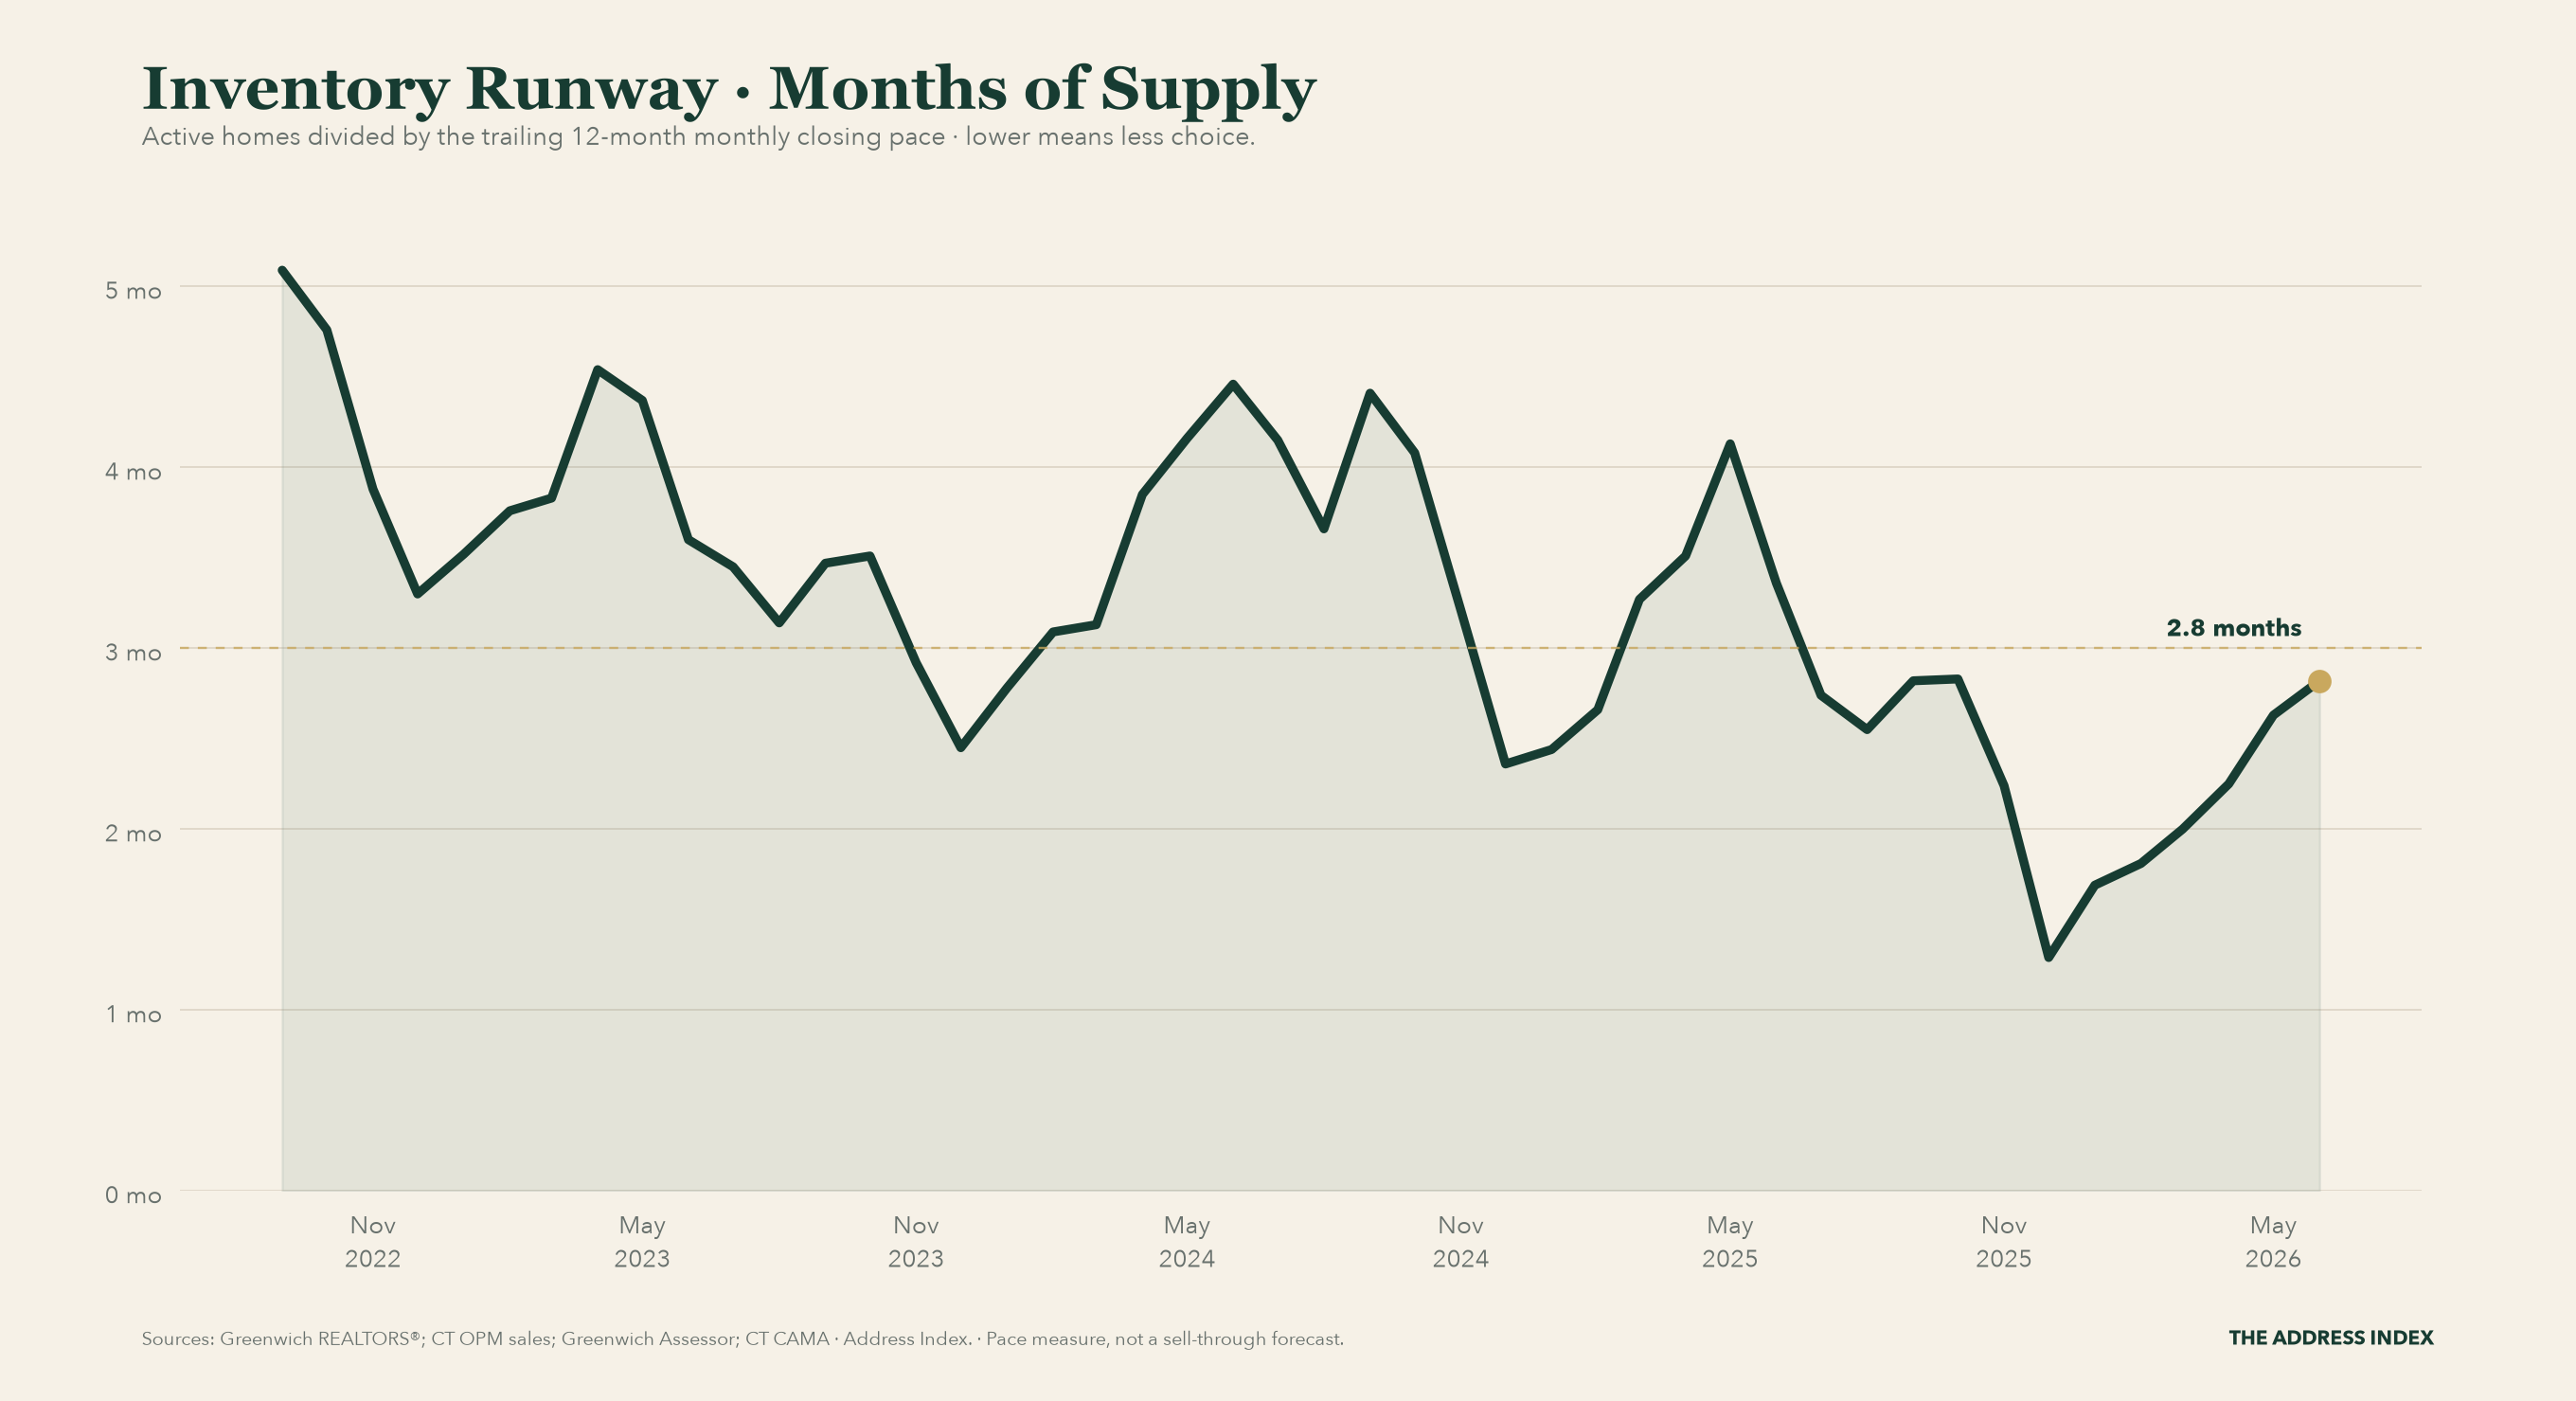
Inventory Runway · Months of Supply
At the recent closing pace, Greenwich's 124 active single-family homes represented 2.9 months of supply in September 2026. This is a pace estimate, not a prediction that every listed home will sell.
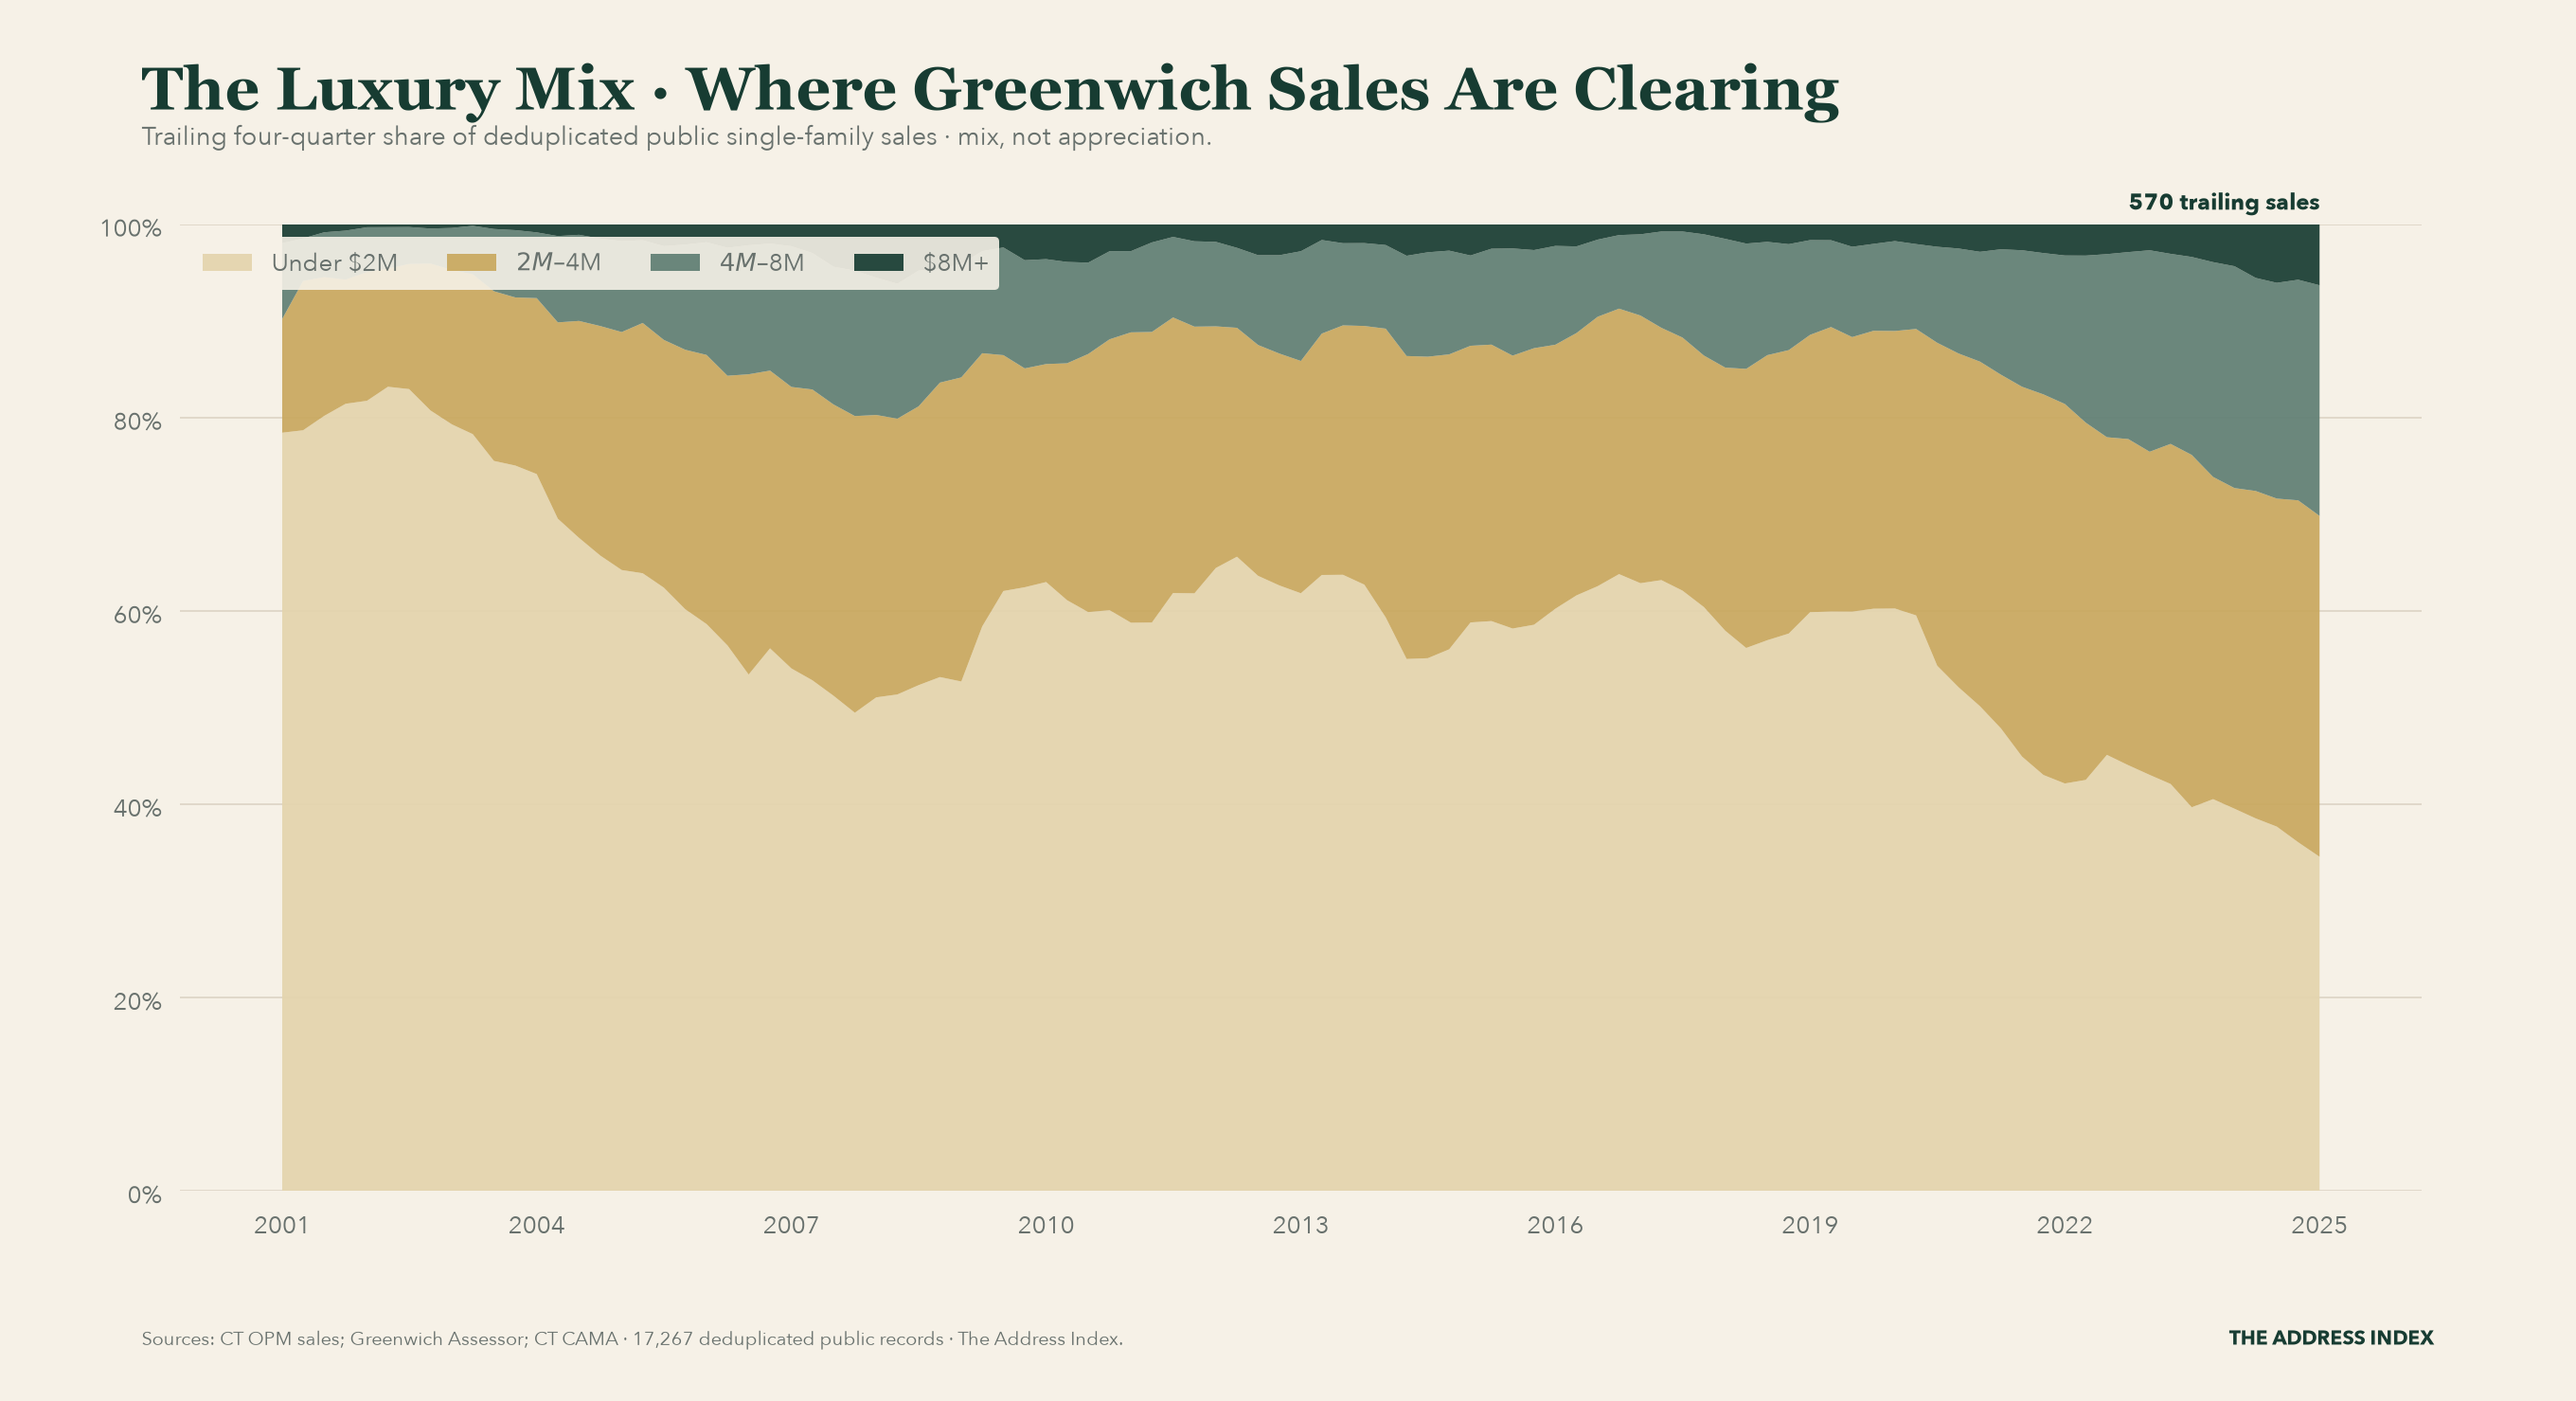
The Luxury Mix · Where Greenwich Sales Are Clearing
In the trailing year through 2026 Q2, 35.0% of 445 deduplicated public sales cleared at $4M or more, including 10.1% at $8M+. This chart measures sales mix, not appreciation.
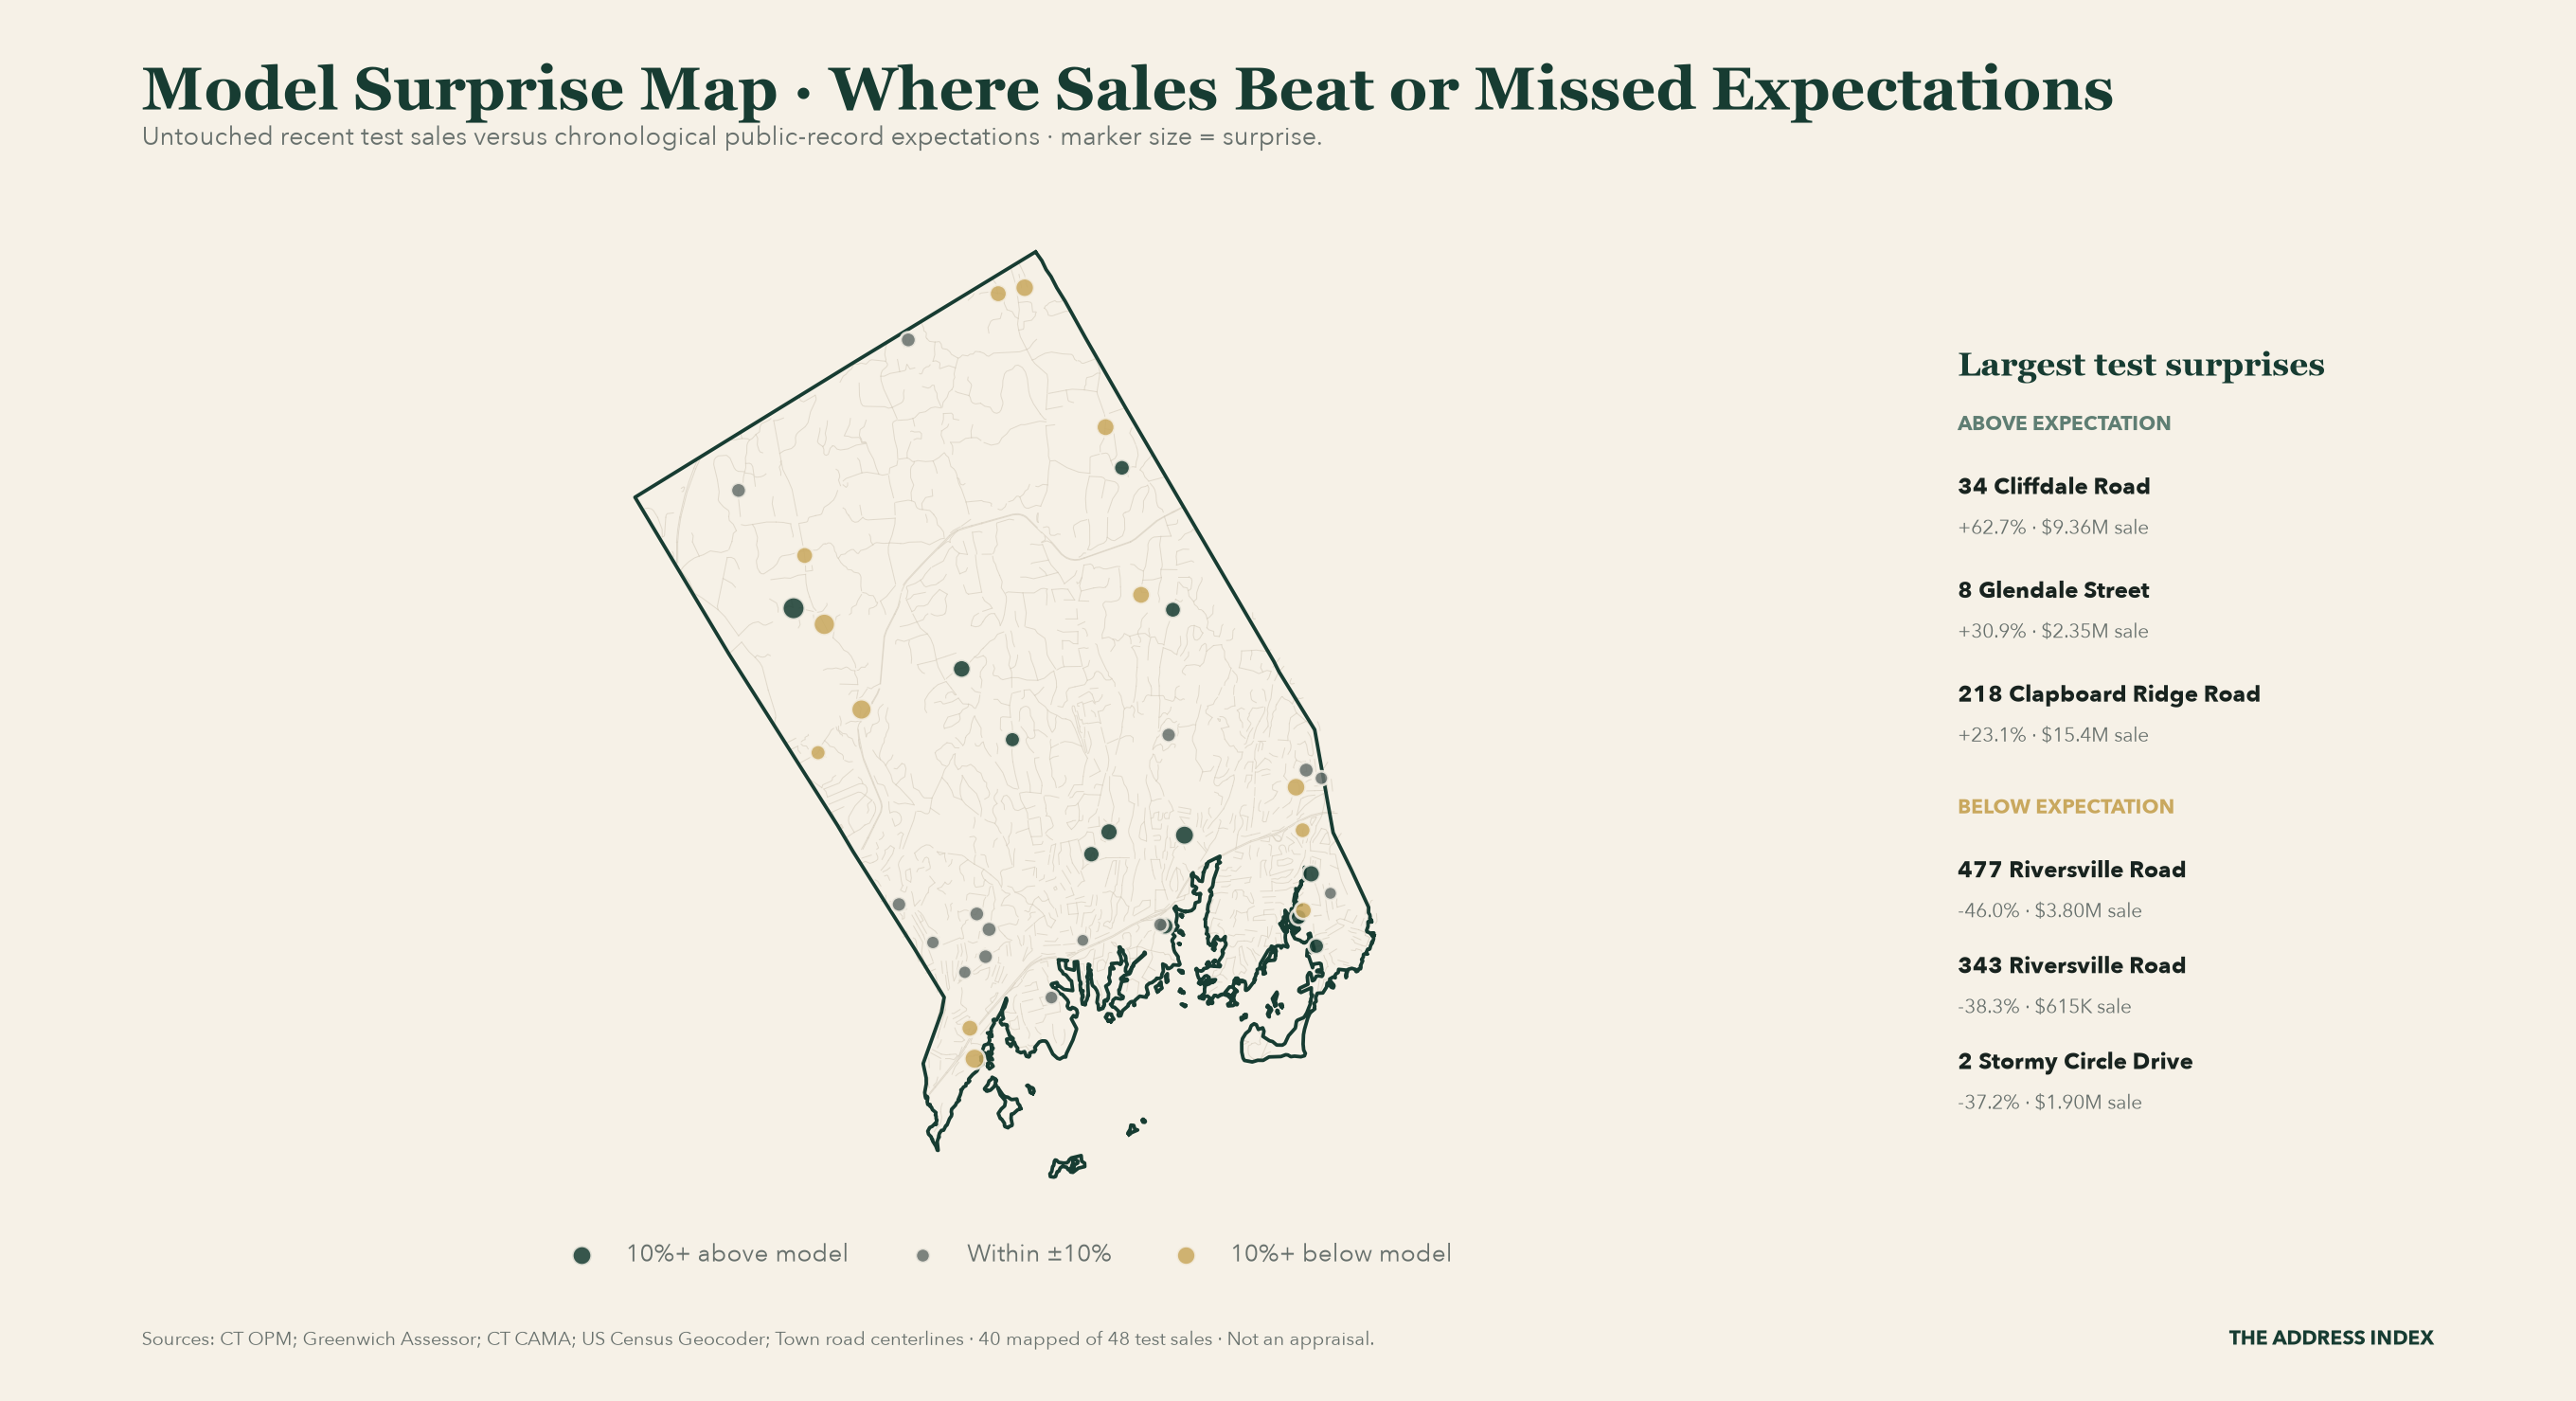
Model Surprise Map · Where Sales Beat or Missed Expectations
Across 48 untouched recent test sales, the median result was -22.2% versus the pre-sale public-record expectation; 46 have verified public coordinates. Select a point in the interactive dashboard to inspect the sale. This is model-error context, not an appraisal or a neighborhood ranking.
Market heat
Balanced
A relative score of price momentum, inventory tightness, market speed, and trailing sales liquidity.
Heat score components
Monthly tape
| Month | Reported median | 12-month signal | Market-level index | Closings | Inventory | Supply | Leverage | Days |
|---|---|---|---|---|---|---|---|---|
| Sep 2026 | $2.94M | $3.37M | 121.9 | 38 | 124 | 2.9 mo | 53 | 40 |
| Aug 2026 | $3.95M | $3.35M | 121.1 | 37 | 83 | 2.0 mo | 59 | 17 |
| Jul 2026 | $3.60M | $3.26M | 117.7 | 74 | 113 | 2.6 mo | 52 | 36 |
| Jun 2026 | $3.81M | $3.25M | 117.4 | 58 | 122 | 2.8 mo | 52 | 37 |
| May 2026 | $3.15M | $3.26M | 117.7 | 50 | 114 | 2.6 mo | 48 | 69 |
| Apr 2026 | $4.00M | $3.22M | 116.3 | 36 | 99 | 2.2 mo | 60 | 39 |
| Mar 2026 | $2.79M | $3.16M | 114.0 | 29 | 89 | 2.0 mo | 53 | 85 |
| Feb 2026 | $2.57M | $3.28M | 118.3 | 21 | 79 | 1.8 mo | 67 | 57 |
| Jan 2026 | $4.49M | $3.38M | 122.0 | 37 | 74 | 1.7 mo | 72 | 91 |
| Dec 2025 | $3.15M | $3.34M | 120.6 | 47 | 56 | 1.3 mo | 76 | 65 |
| Nov 2025 | $3.06M | $3.32M | 119.8 | 44 | 96 | 2.2 mo | 76 | 69 |
| Oct 2025 | $2.98M | $3.25M | 117.4 | 36 | 120 | 2.8 mo | 61 | 83 |
Latest Address Index quarters
| Quarter | Index | 95% interval | Evidence | Repeat-pair evidence |
|---|---|---|---|---|
| 2026 Q3 | 125.3 | 111.4–140.9 | nowcast | 0 |
| 2026 Q2 | 120.7 | 114.1–127.7 | reconstructed | 22 |
| 2026 Q1 | 122.2 | 116.5–128.1 | reconstructed | 61 |
| 2025 Q4 | 114.2 | 108.9–119.8 | reconstructed | 81 |
| 2025 Q3 | 111.4 | 106.4–116.8 | observed | 116 |
| 2025 Q2 | 108.4 | 103.7–113.3 | observed | 102 |
| 2025 Q1 | 103.5 | 99.5–107.7 | observed | 68 |
| 2024 Q4 | 102.4 | 99.9–104.9 | observed | 76 |
| 2024 Q3 | 99.9 | 98.5–101.4 | observed | 127 |
| 2024 Q2 | 99.2 | 97.7–100.6 | observed | 110 |
| 2024 Q1 | 98.6 | 96.4–100.8 | observed | 67 |
| 2023 Q4 | 93.0 | 89.5–96.7 | observed | 81 |
Method and data quality
Address Index
A weighted repeat-sales model of the same Greenwich single-family properties over time. Quarterly estimates are smoothed over four quarters and scaled so the 2024 average equals 100.
Same House Test
Splits repeat-sale intervals into 1,690 with public evidence of rebuilding or substantial modernization and 3,847 with no recorded major change. It is an evidence comparison, not an estimate of renovation ROI.
Synthetic Twin
The data stays chronological: 2,289 earlier sales fit the model, 501 later sales set the ranges, and 501 newest sales remain untouched for the final test. Median test error is 22.4%. The 50% likely zone captured 44.7% of test sales; the 80% broader range captured 72.7%. Market comparison, not an appraisal.
Observed, reconstructed, nowcast
Observed quarters have direct state transaction coverage. Reconstructed quarters rely more heavily on public parcel sale histories or interpolation. After 2026 Q2, the dashed line is a transparent nowcast from official monthly reports.
Monthly dots
Each gold dot is the official median for one month. The dots are not connected because they describe different baskets of sold homes and should not be read as month-to-month appreciation.
Time on market
The long-run line is a listing-count-weighted composite of Realtor.com median listing time across Greenwich's five ZIP codes since 2016. The recent GAR line is the reported average for sold single-family homes. They are labeled separately because they are not the same statistic.
Buyer–Seller Leverage
Applies the published Market Heat weights to every complete month. Below 35 is buyer-leaning, 35–65 balanced, and above 65 seller-leaning. It is relative to the displayed Greenwich history, not a promise about a particular negotiation.
Inventory Runway
Active single-family inventory divided by the monthly closing pace implied by the trailing 12 months. It measures buyer choice at the recent pace—not how long a particular listing will take to sell.
The Luxury Mix
Groups 18,057 deduplicated public sales into four nominal price bands and shows each band’s trailing four-quarter share. The latest available transaction quarter is labeled separately because it can lag monthly reports. Mix is not appreciation.
Model Surprise Map
Plots verified coordinates for untouched Synthetic Twin test sales. Green cleared more than 10% above the chronological public-record expectation, gold more than 10% below, and gray within ±10%. It shows where the public model missed—not why.
Uncertainty
The shaded range is a 95% statistical interval. It widens when direct observations are sparse and widens further for the current nowcast. The center line is an estimate, not an appraisal.
Current coverage
20,159 state transaction rows, 4,842 Town archive rows, 19,363 parcel records, and 5,765 eligible repeat-sale pairs.
Revisions
Published index readings are compared with each new build. A material change to a quarter already published is announced on this page and logged in the revision history.
Sources and audit
State transactions · Town assessor archive · Town GIS map · listing-time history · latest market report · validation JSON.
Directional market intelligence only—not an appraisal, brokerage opinion, or investment recommendation.