Greenwich Housing Inventory, Sales, and Market Speed
Compare Greenwich single-family inventory, monthly closings, and days on market in three aligned historical charts.
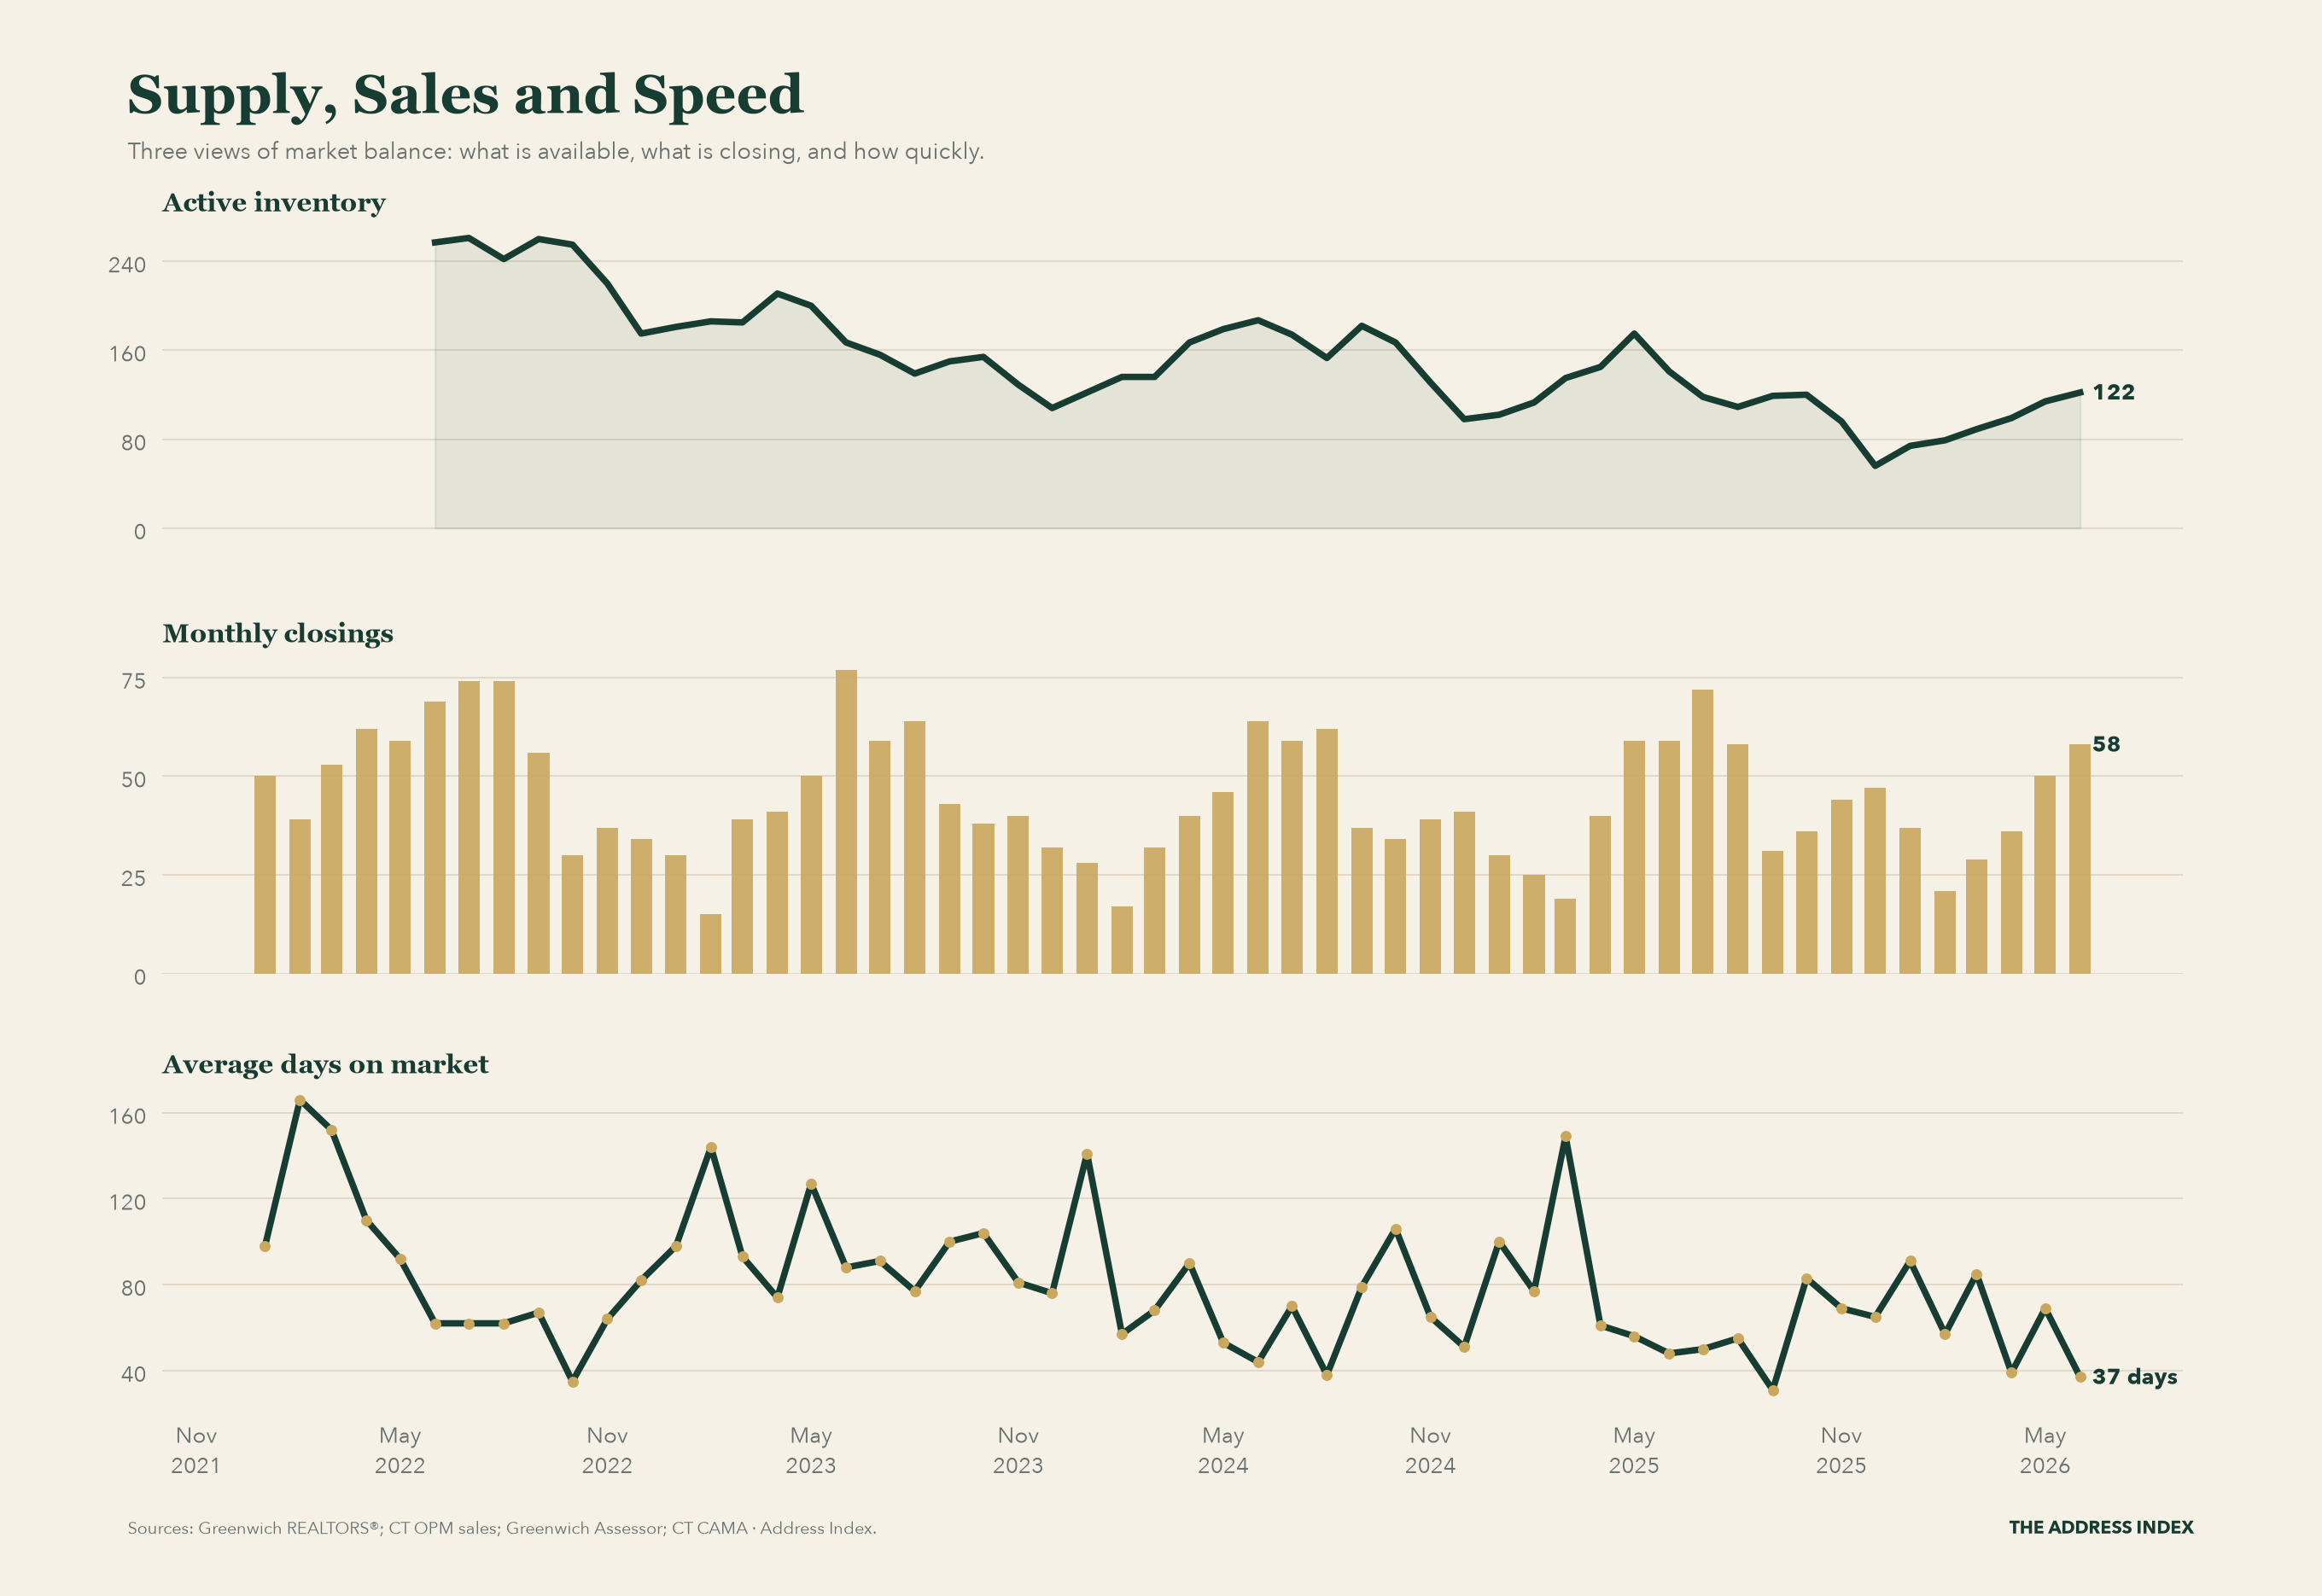
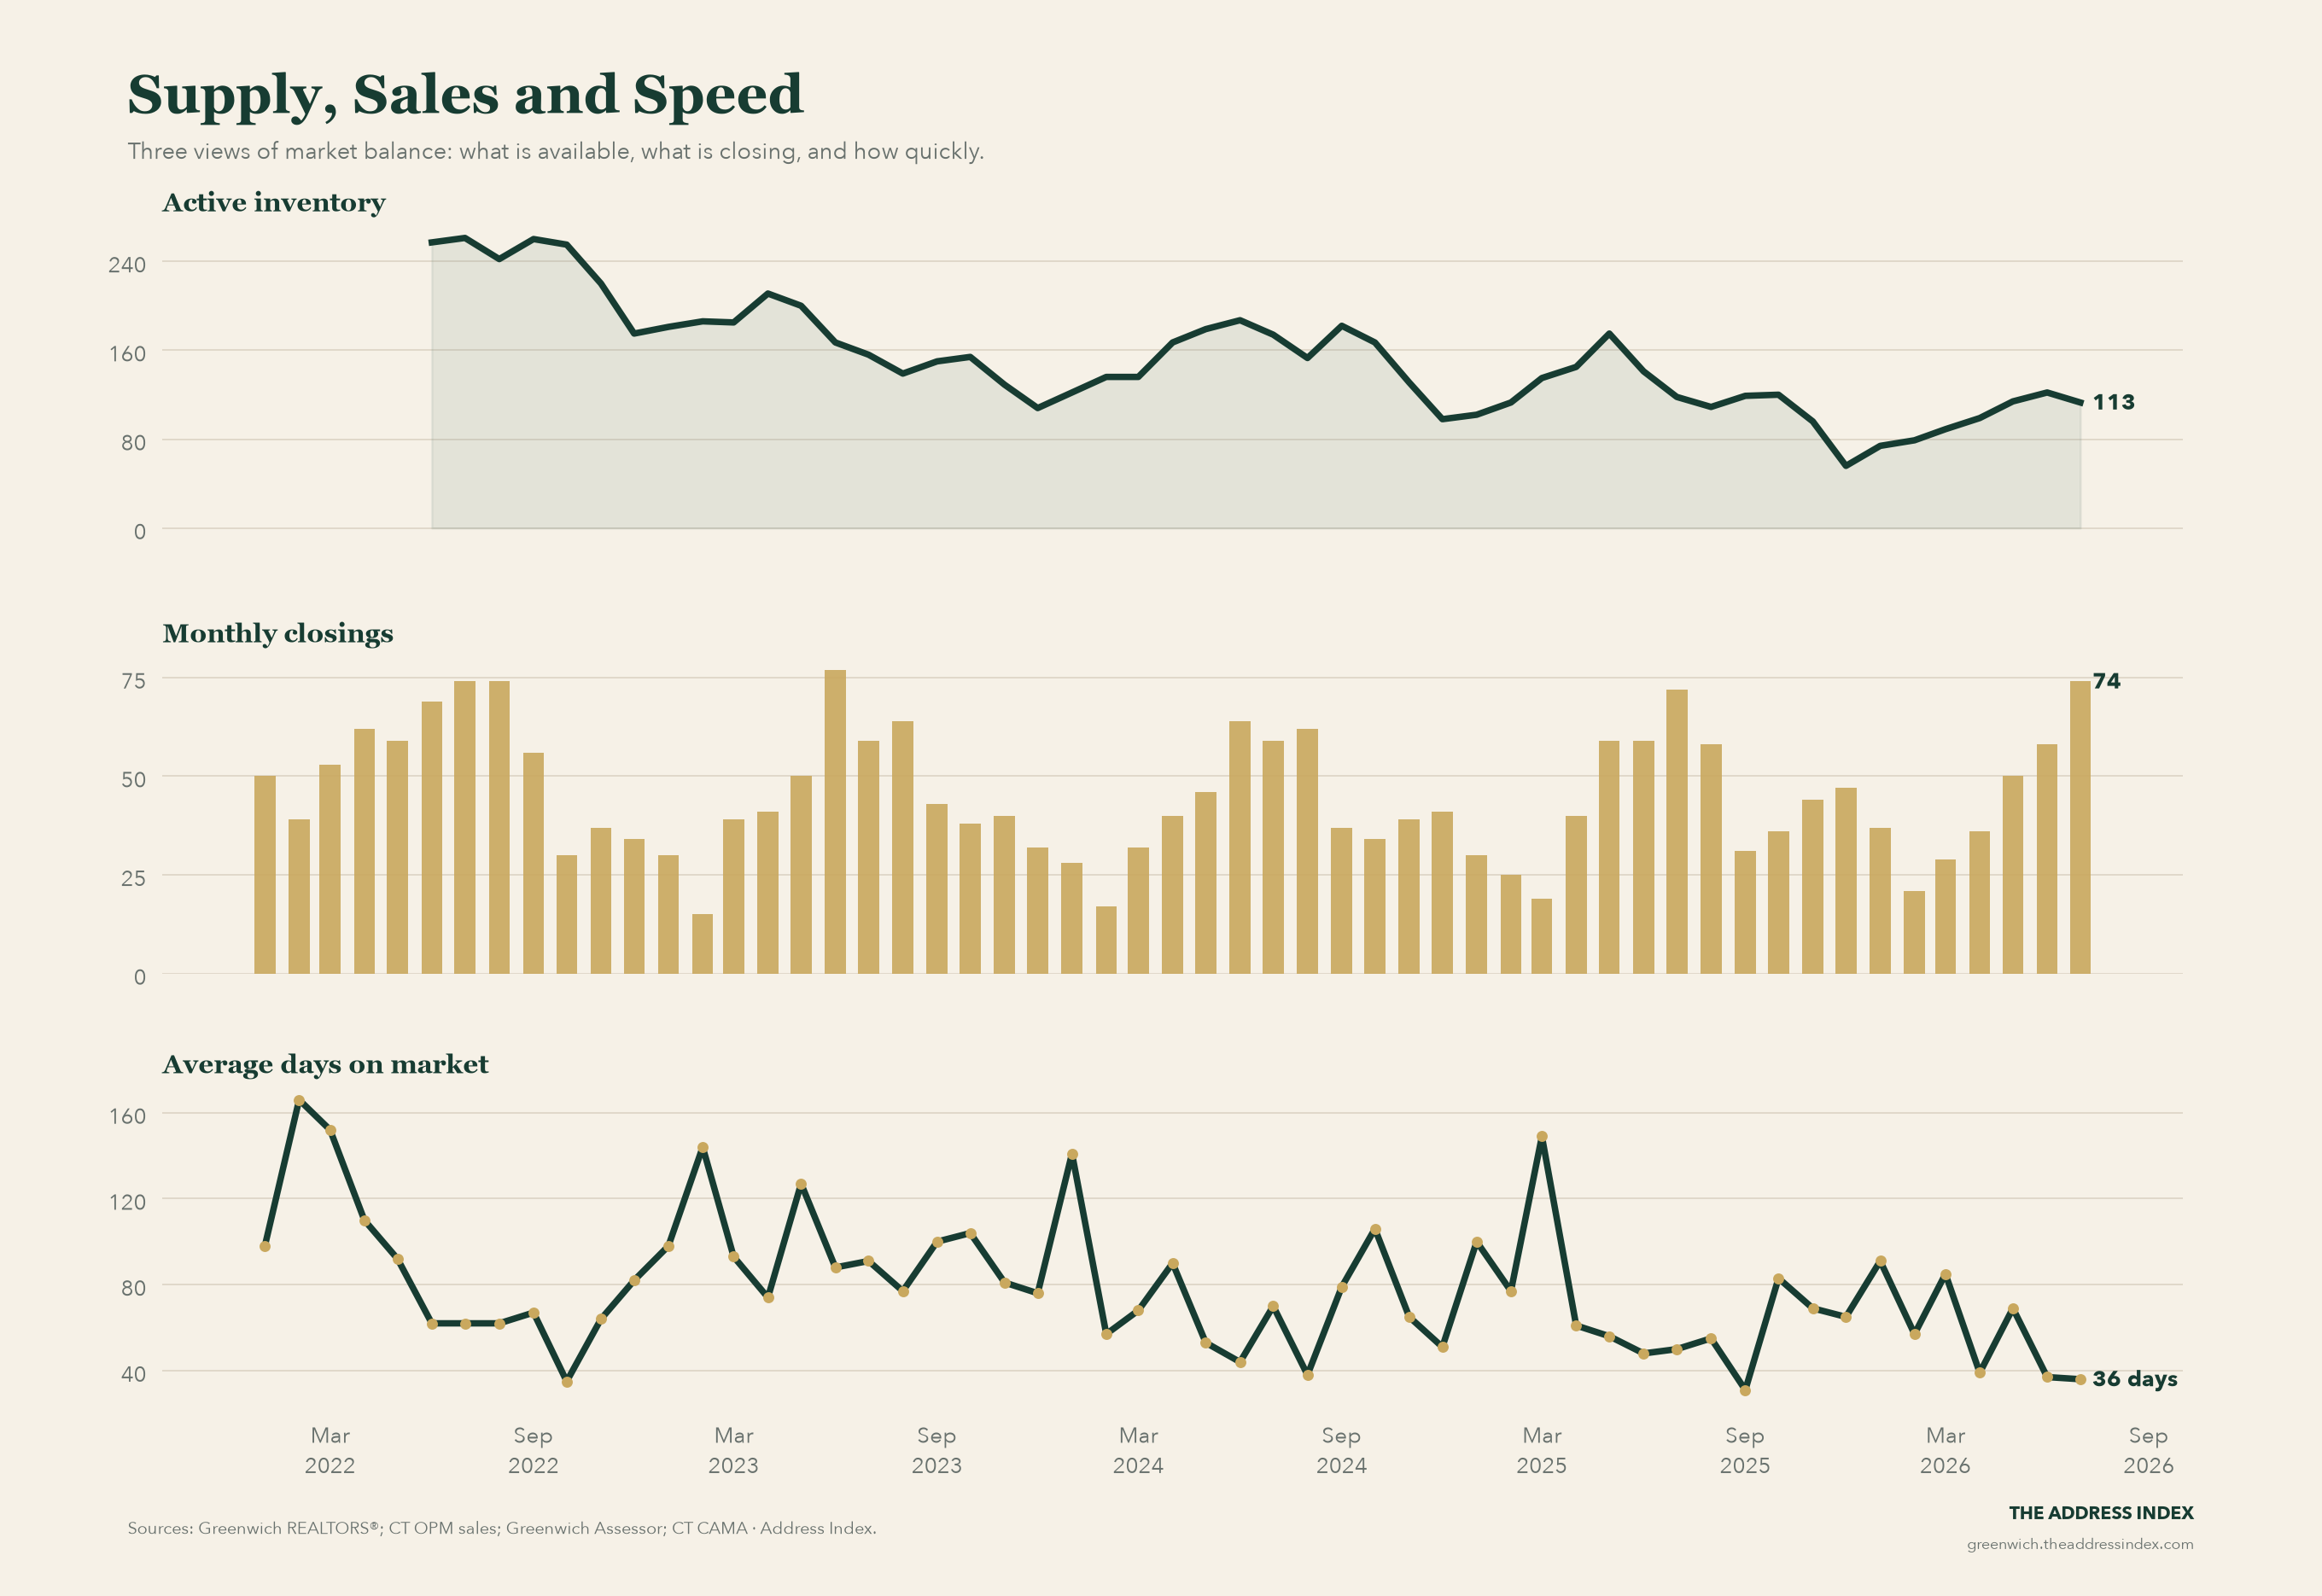
Greenwich ended July 2026 with 113 active single-family homes, 74 closings, and an average 36 days on market.
What this chart measures
Supply, sales, and speed describe different parts of the same Greenwich market. Aligning them shows whether choice is expanding, demand is clearing, and homes are moving faster or slower.
How to read it
Read the panels vertically for the same month: inventory measures available choice, closings measure completed liquidity, and days on market measures the pace of successful listings.
Why it matters
A price statistic alone cannot distinguish a healthy market from a thin one. These operating measures expose the conditions buyers and sellers actually encounter.
Latest reading: Greenwich ended July 2026 with 113 active single-family homes, 74 closings, and an average 36 days on market.
The Address Index is independent market intelligence based on public and source-linked records. It is not an appraisal, brokerage opinion, or investment recommendation.
Related Greenwich real estate charts
Get The Address Index in your inbox.
The dashboard is public during launch. Paid membership adds the complete weekly analysis, adjusted comparable-sale work, model diagnostics, monthly deep dives, and the archive through Substack.
Subscribe to The Address Index