Greenwich Same-House Price Test
Compare Greenwich repeat-sale price paths for homes with public evidence of major improvement and homes with no recorded major change.
Index revised Sep 19, 2026. The 2026 Q2 Address Index reading was revised from 105.7 (-1.7% YoY, nowcast) to 120.7 (+11.4% YoY, reconstructed).
Newer public parcel sale histories added 447 usable sales and extended the fitted repeat-sales index from 2025 Q3 through 2026 Q2. Quarters after the latest state transaction file (2025 Q3) are now estimated from those reconstructed repeat-sale pairs instead of the monthly-report nowcast, and 2025 Q2 and Q3 were revised up as more pairs were added.
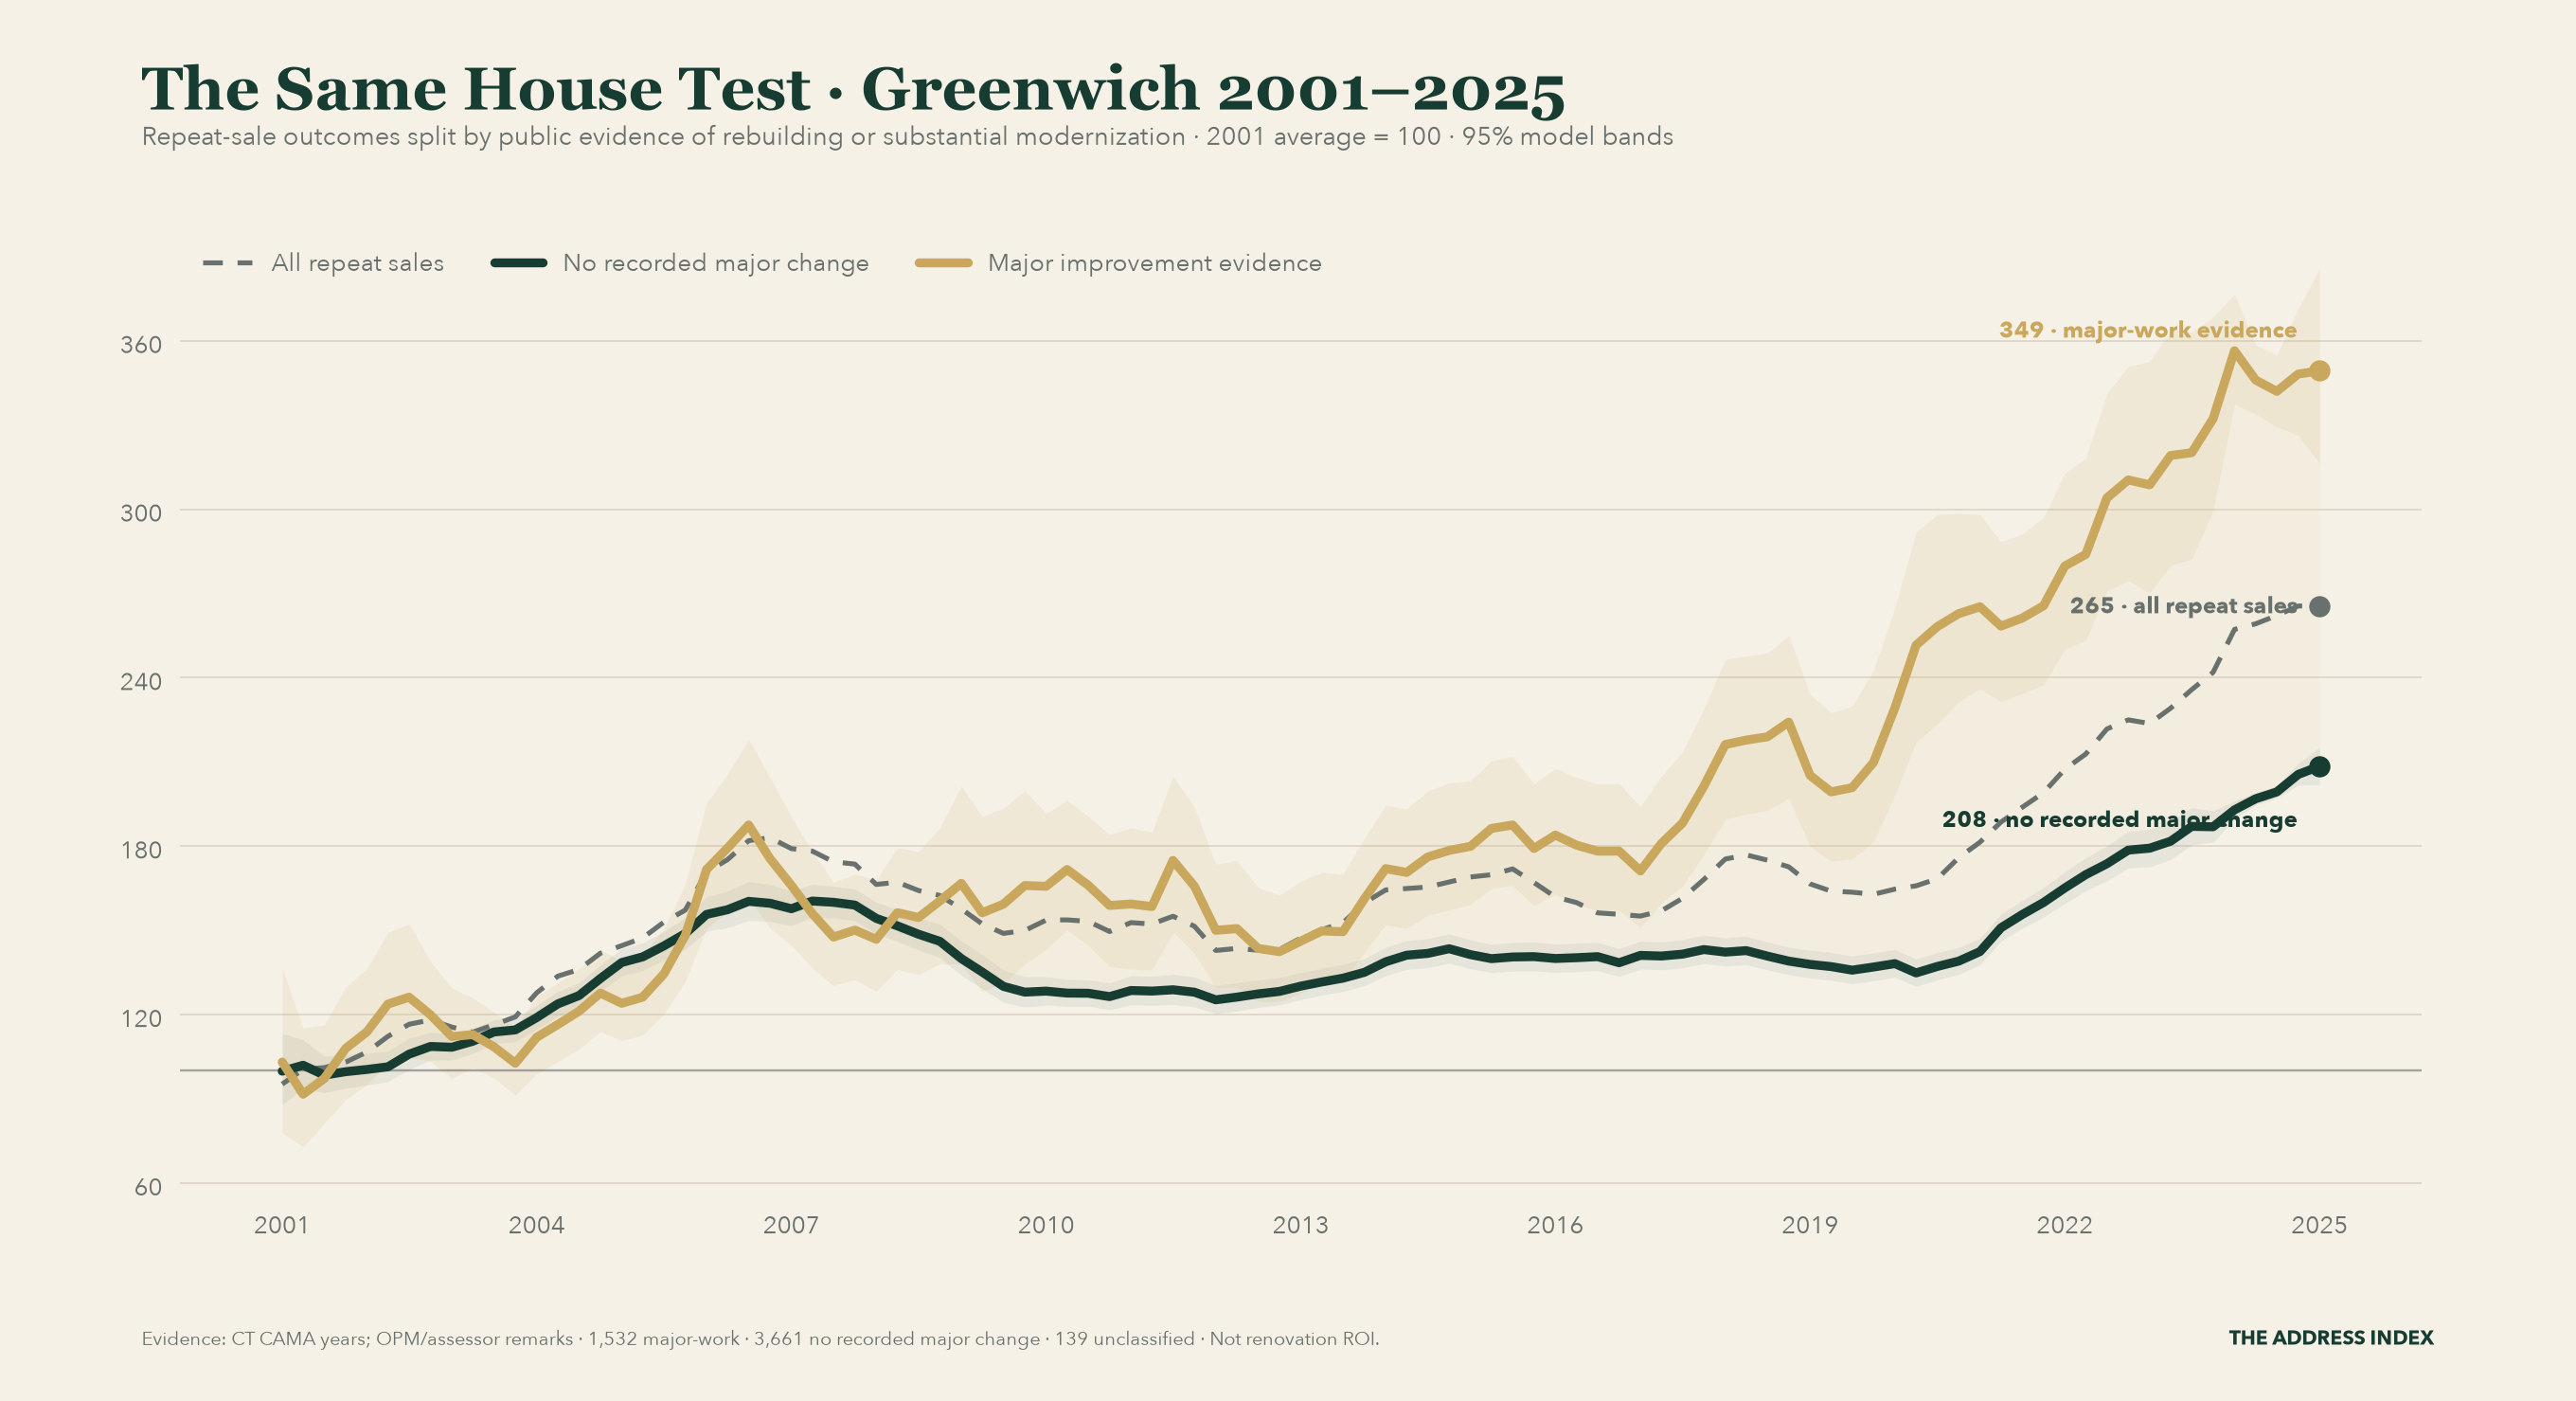
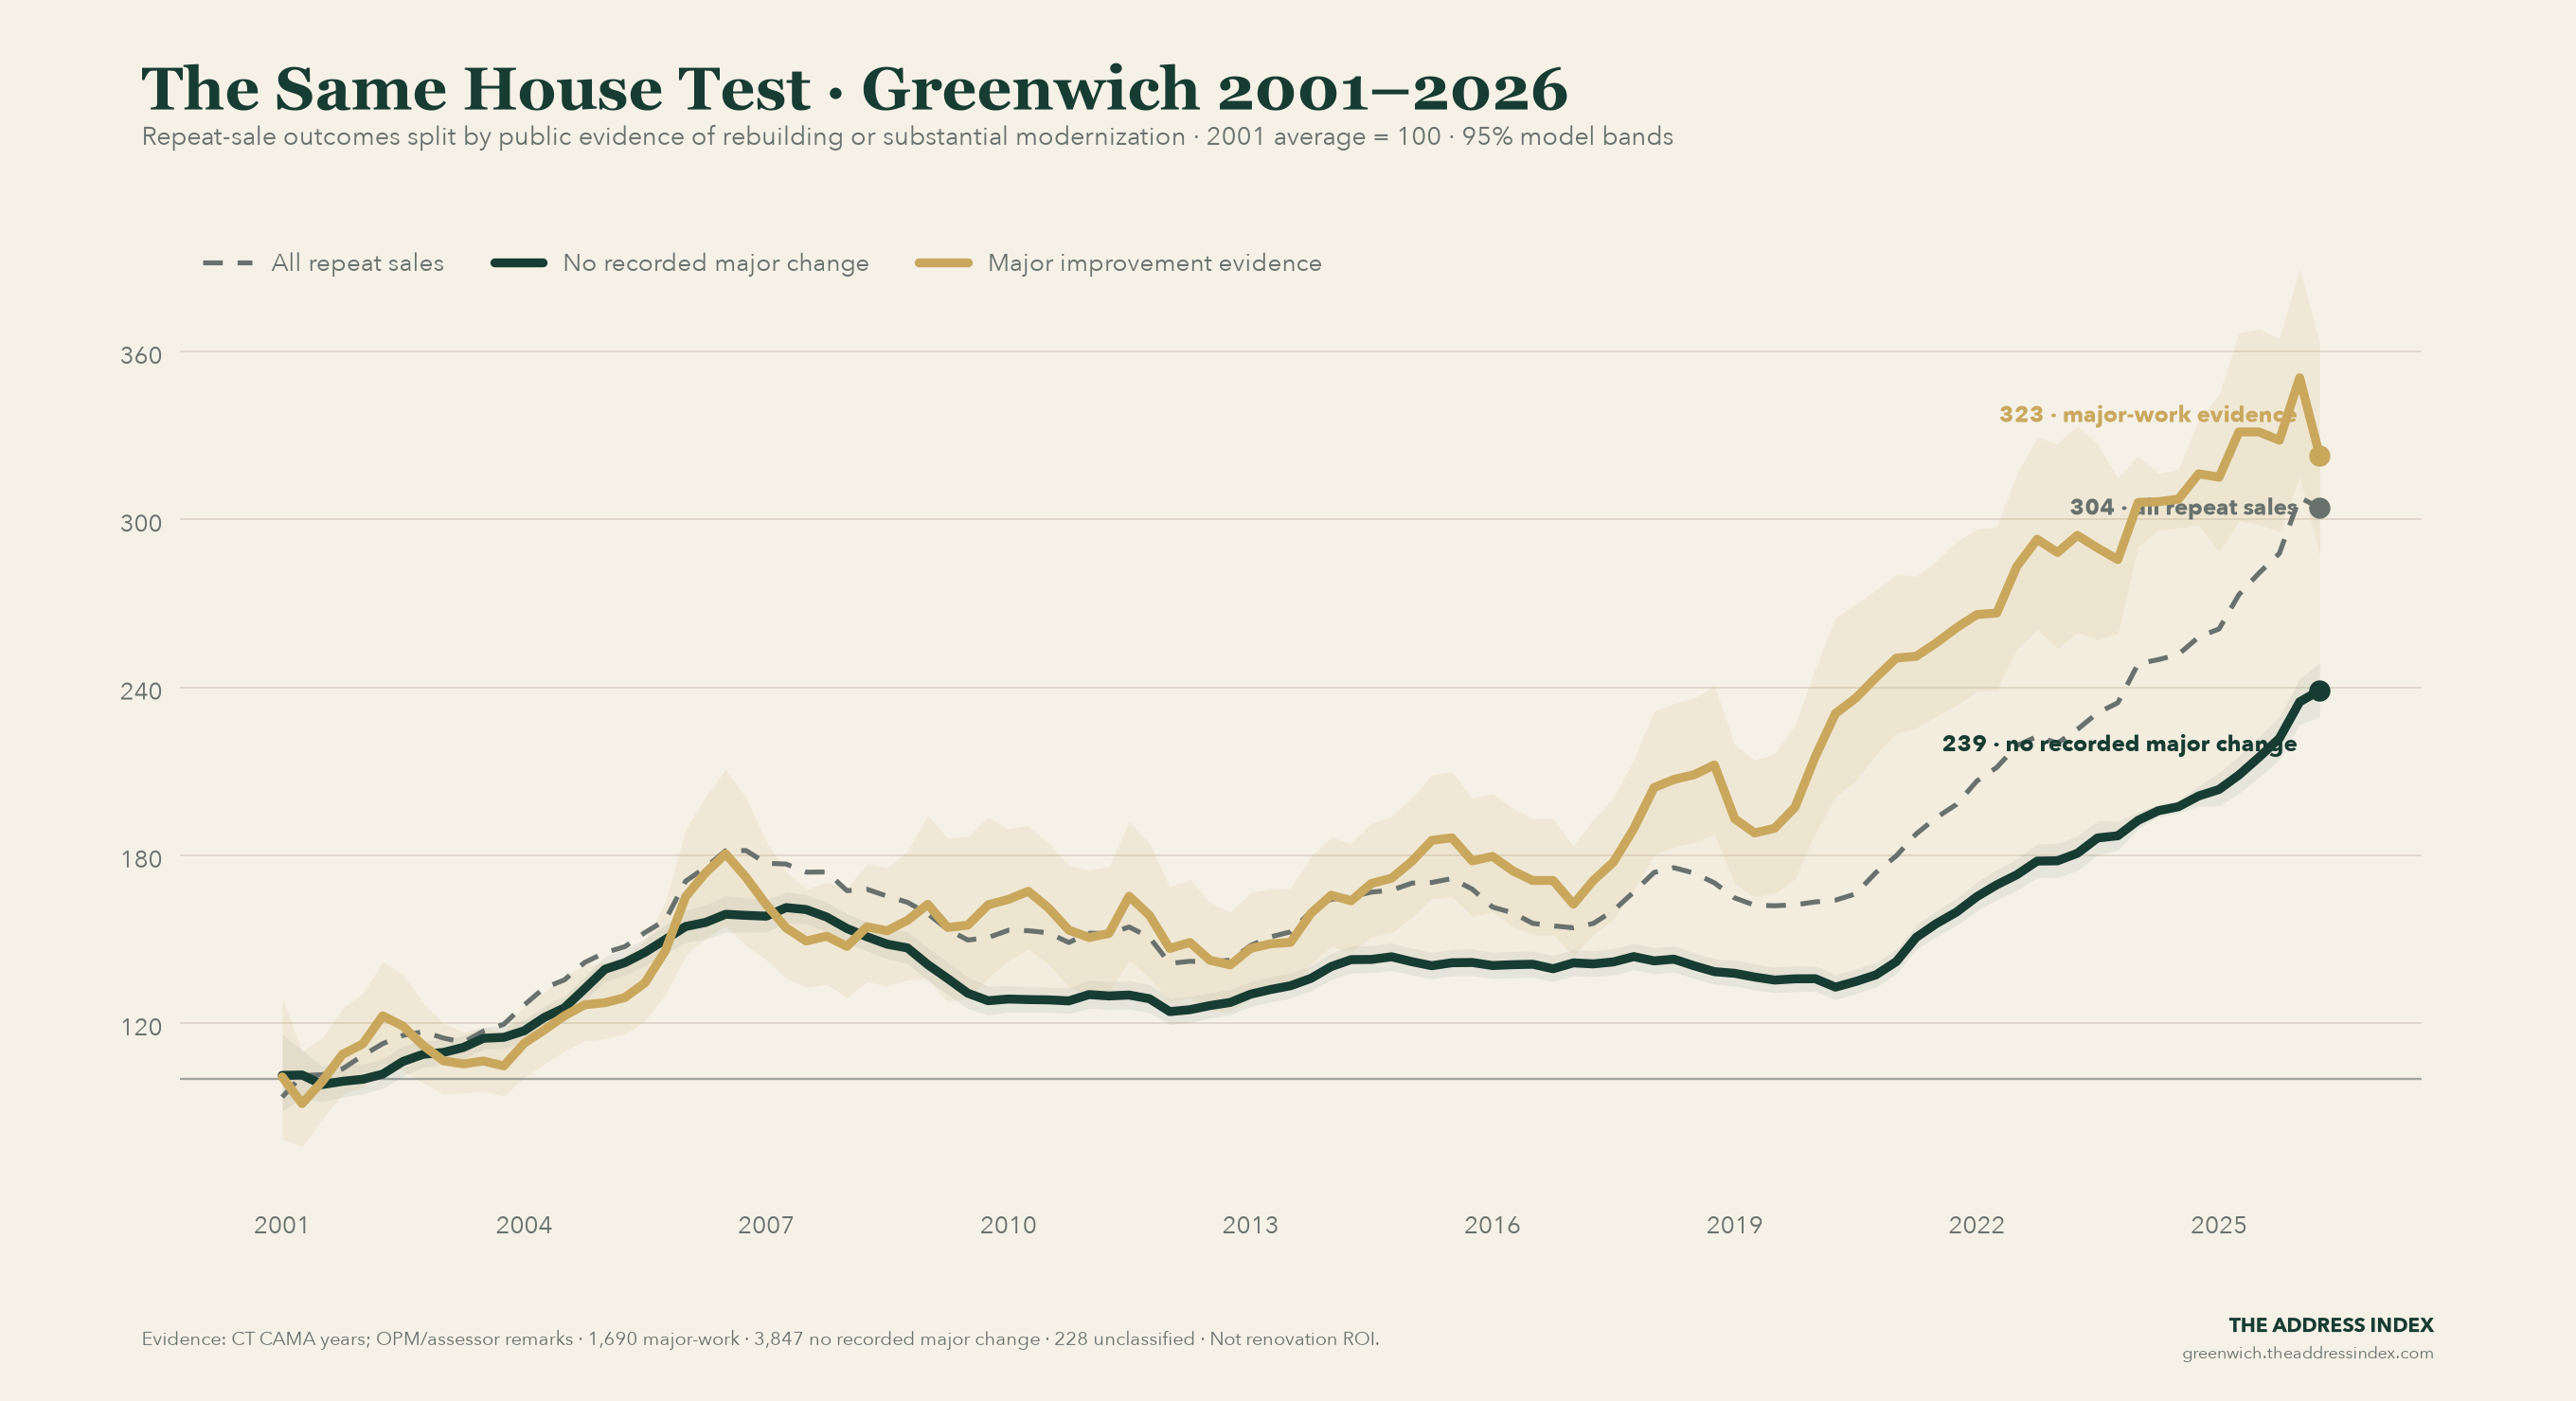
Among eligible repeat-sale intervals, 1,690 carry public evidence of rebuilding or substantial modernization and 3,847 have no recorded major change. Since the 2001 base, their modeled resale paths reached 323 and 239, respectively, versus 304 for all repeat sales. This is an evidence split, not a renovation-return estimate.
Get the next update to this chart in your inbox
Free subscribers receive previews and selected findings. Paid members get the complete Thursday briefing, property comparisons and dated follow-ups. Public research tools stay free.
Subscribe free for previews · Upgrade for the full Thursday edition. Prefer Substack? Subscribe there instead.
What this chart measures
The Same House Test separates repeat-sale intervals with public evidence of rebuilding or substantial modernization from intervals without a recorded major change.
How to read it
The lines are indexed paths, not estimates of renovation return. They show how the two public-record groups evolved relative to the same starting period.
Why it matters
Greenwich value growth partly reflects capital invested in the housing stock. Separating recorded major improvements helps readers avoid treating every resale gain as pure market appreciation.
Latest reading: Among eligible repeat-sale intervals, 1,690 carry public evidence of rebuilding or substantial modernization and 3,847 have no recorded major change. Since the 2001 base, their modeled resale paths reached 323 and 239, respectively, versus 304 for all repeat sales. This is an evidence split, not a renovation-return estimate.
The Address Index is independent market intelligence based on public and source-linked records. It is not an appraisal, brokerage opinion, or investment recommendation.
Related Greenwich real estate charts
Get the complete Greenwich briefing.
Paid members receive the complete Thursday briefing, property case studies, dated follow-ups and the paid archive. When a new monthly report arrives, our State of Greenwich analysis puts the numbers in context.
The research desk is public during launch. Free subscribers receive previews and selected findings.
Get the complete briefing on Substack