Greenwich Home Prices and Monthly Market Level
See Greenwich CT monthly median sale prices alongside a steadier trailing 12-month market level for single-family homes.
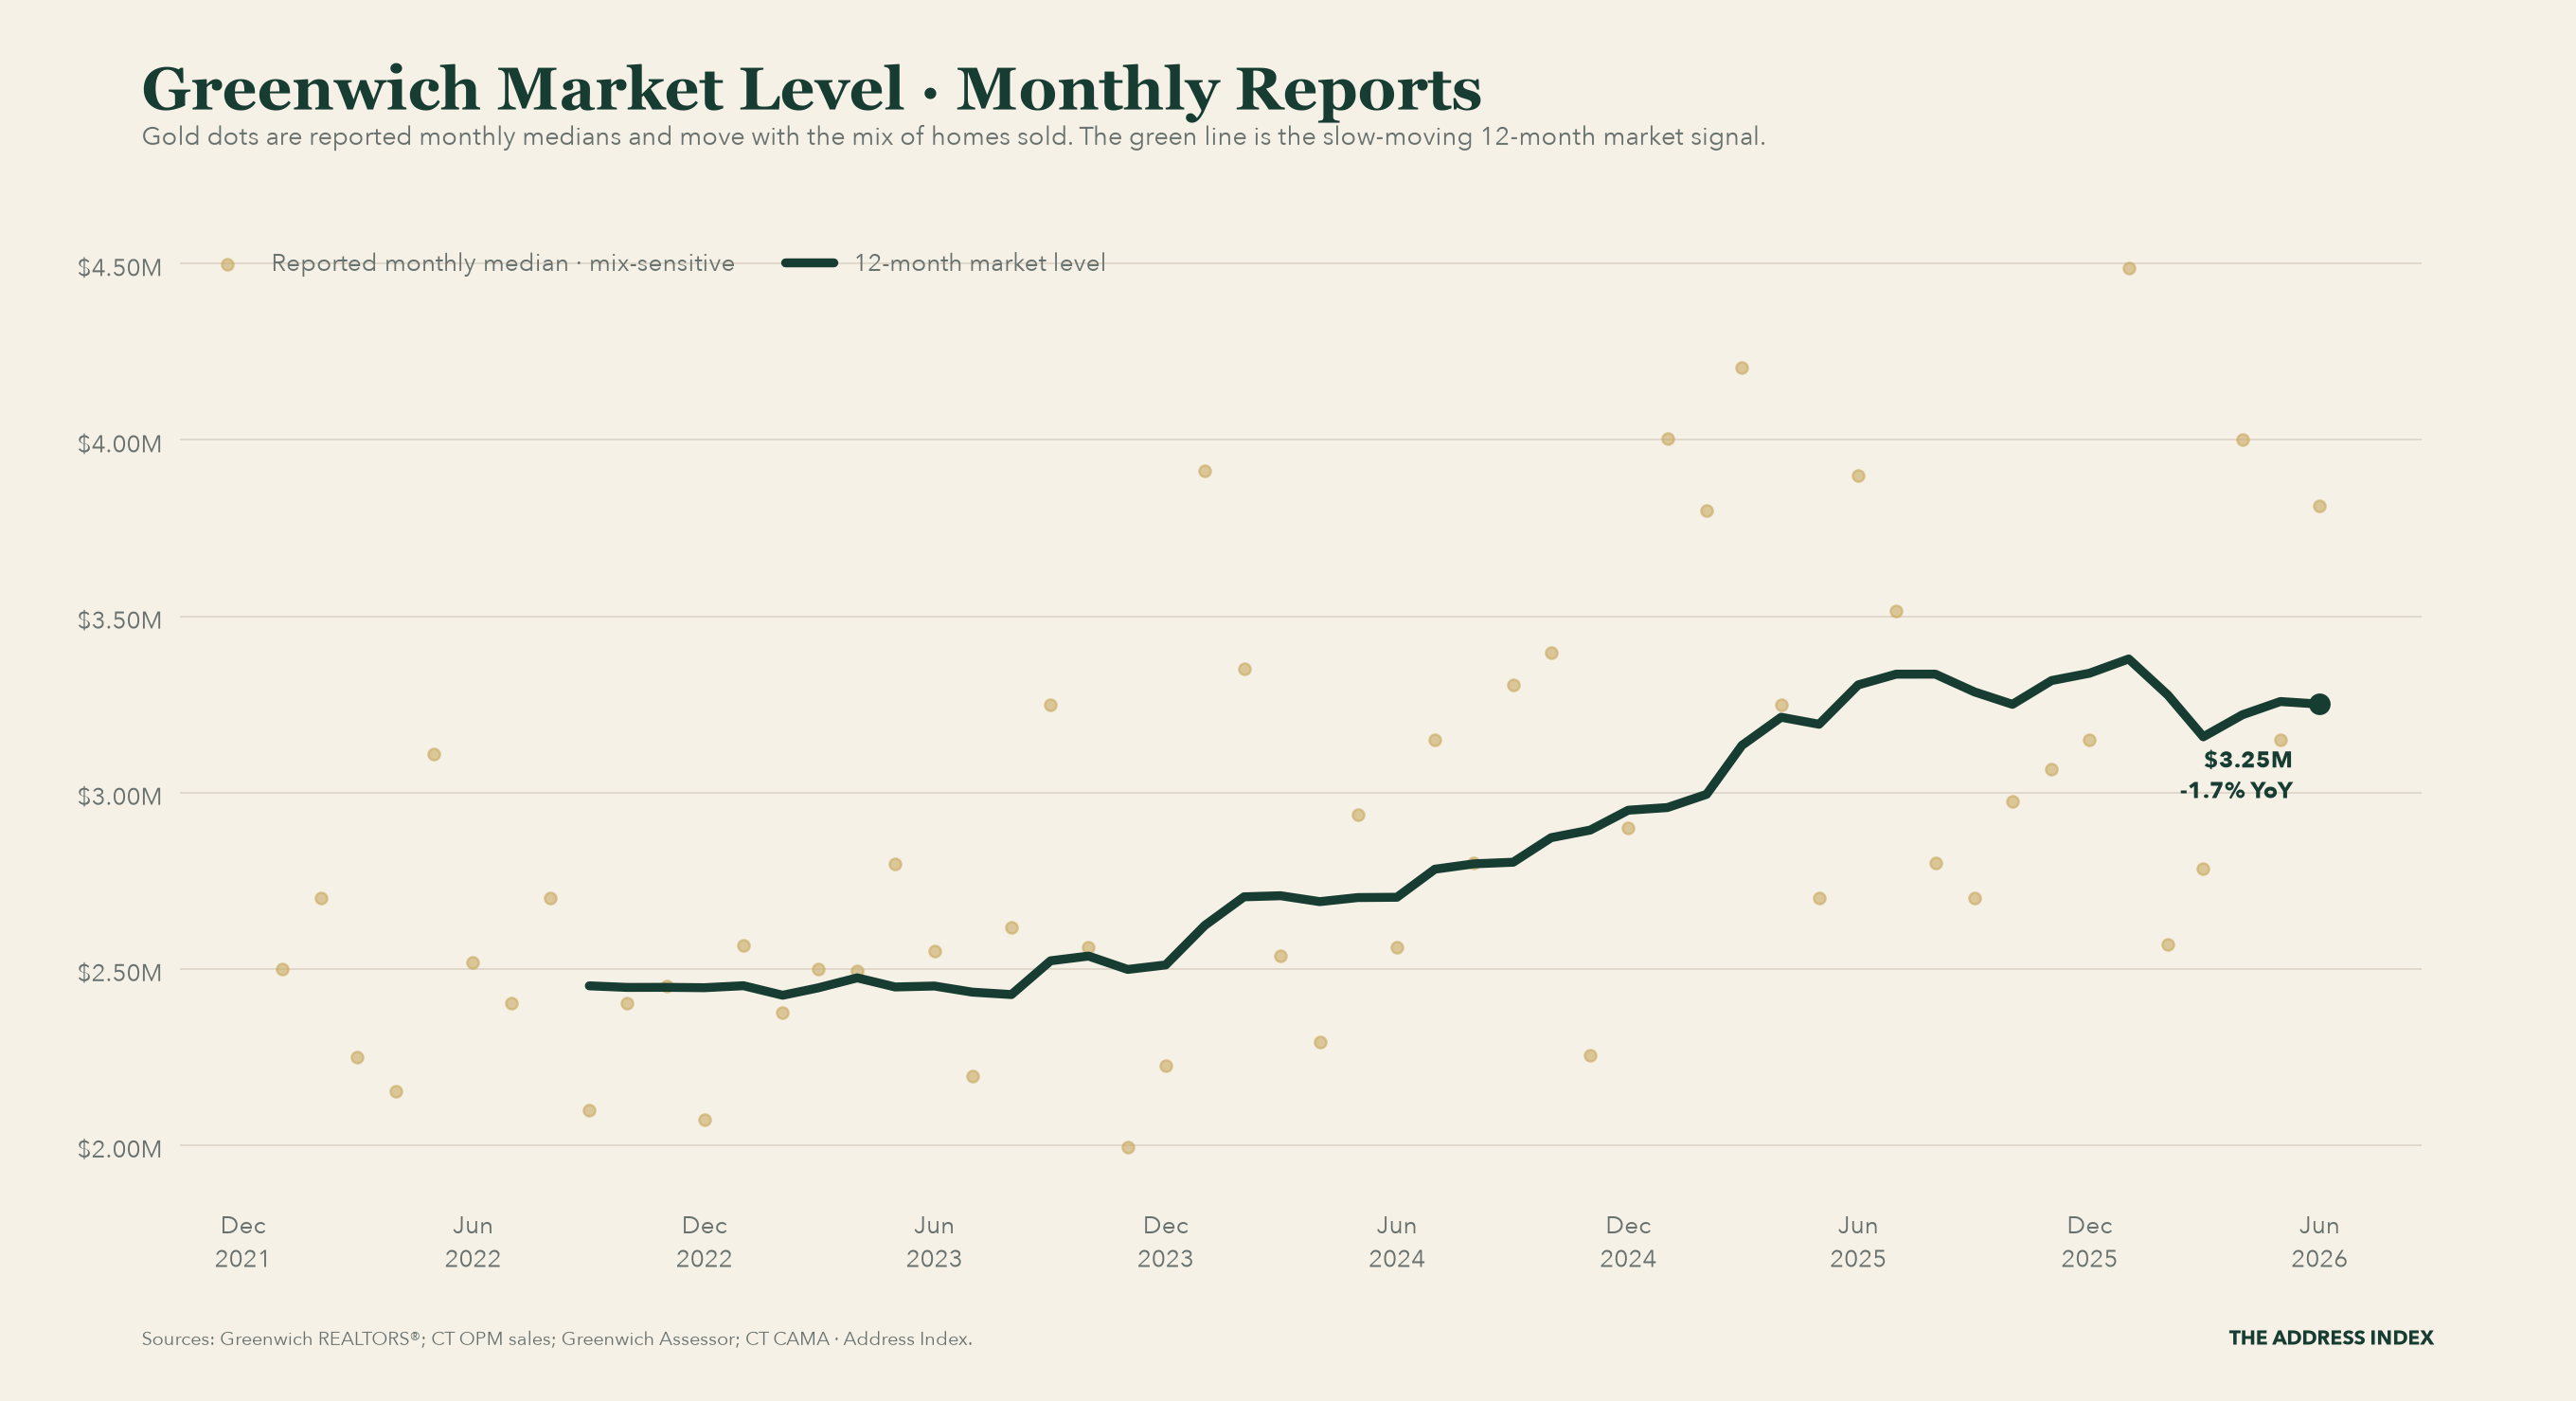
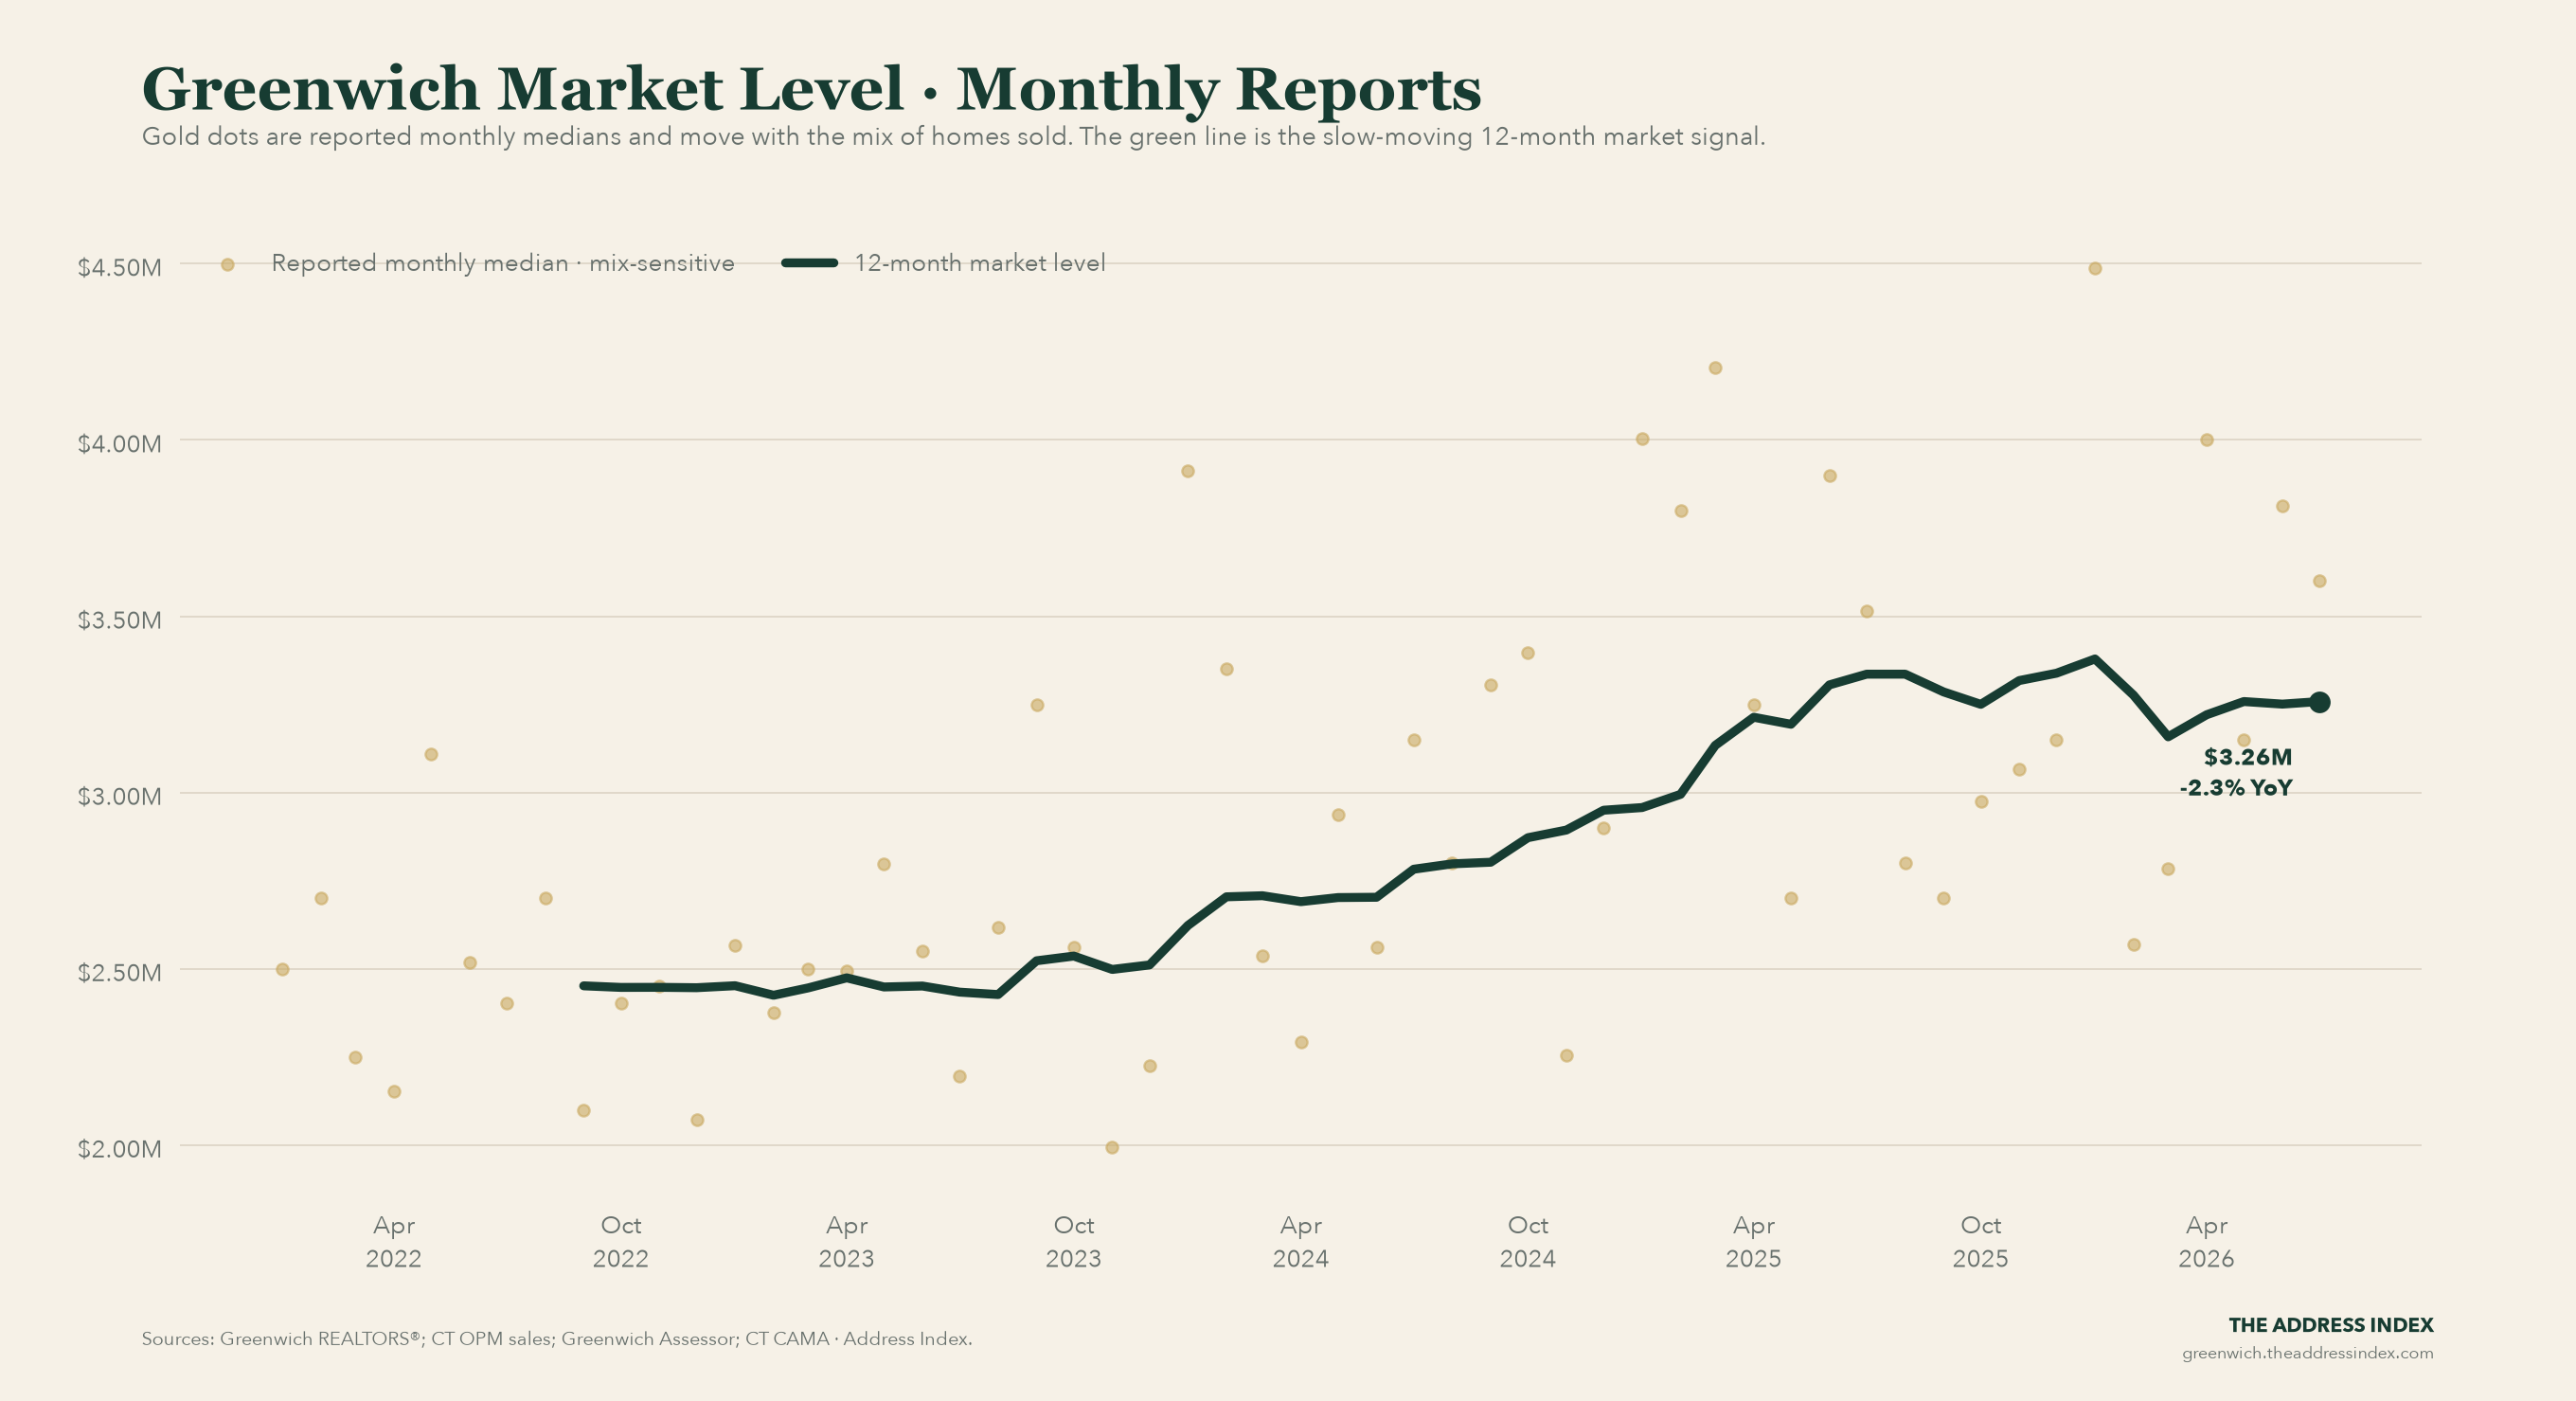
The Greenwich 12-month market level was $3.37M in September 2026, +2.7% from a year earlier. Monthly medians are shown as mix-sensitive context, not connected as a trend.
Get the next update to this chart in your inbox
Free subscribers receive previews and selected findings. Paid members get the complete Thursday briefing, property comparisons and dated follow-ups. Public research tools stay free.
Subscribe free for previews · Upgrade for the full Thursday edition. Prefer Substack? Subscribe there instead.
What this chart measures
This chart places each reported Greenwich monthly median beside a trailing 12-month price signal, preserving both the latest reported result and the more stable market context.
How to read it
Gold dots are separate monthly medians and are intentionally not connected. The green line uses a longer window so an unusual mix of closings does not masquerade as instant appreciation.
Why it matters
Buyers and owners often encounter a dramatic monthly headline. The longer signal helps test whether that headline reflects a durable change or merely the homes that happened to sell.
Latest reading: The Greenwich 12-month market level was $3.37M in September 2026, +2.7% from a year earlier. Monthly medians are shown as mix-sensitive context, not connected as a trend.
The Address Index is independent market intelligence based on public and source-linked records. It is not an appraisal, brokerage opinion, or investment recommendation.
Related Greenwich real estate charts
Get the complete Greenwich briefing.
Paid members receive the complete Thursday briefing, property case studies, dated follow-ups and the paid archive. When a new monthly report arrives, our State of Greenwich analysis puts the numbers in context.
The research desk is public during launch. Free subscribers receive previews and selected findings.
Get the complete briefing on Substack