Greenwich Property Price Model Surprise Map
Map recent Greenwich sales that cleared above or below a chronological public-record price expectation and inspect each result.
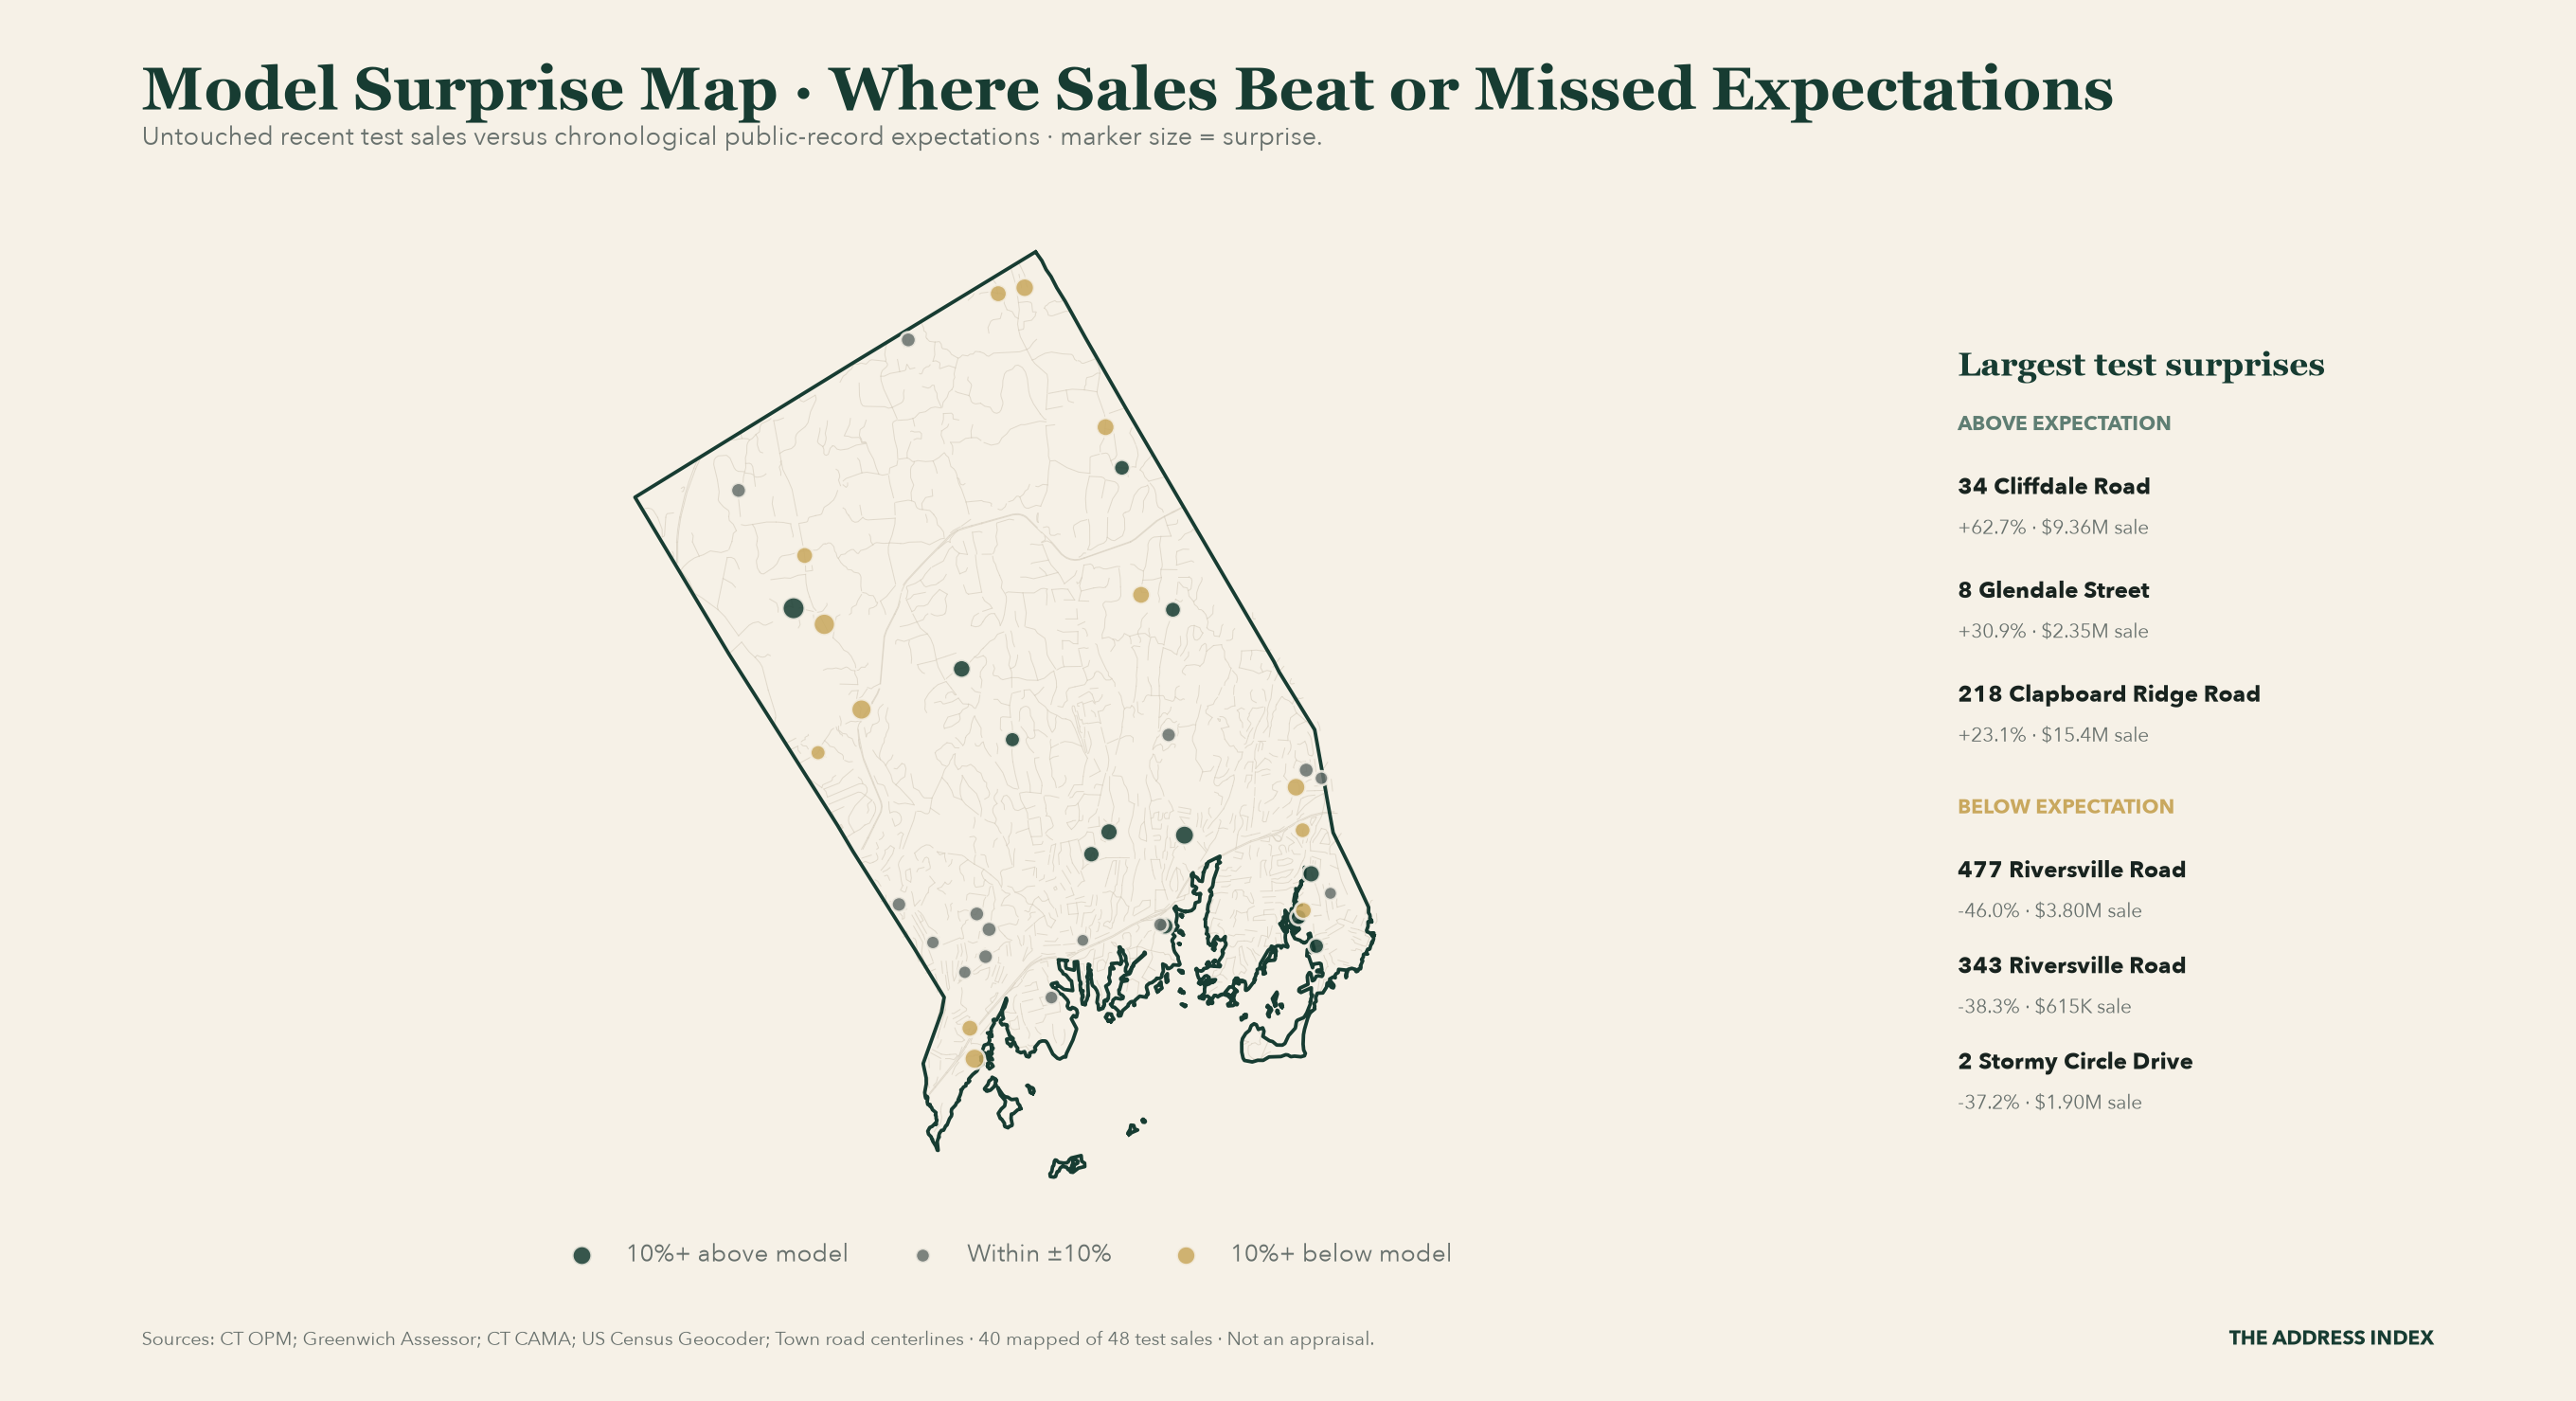
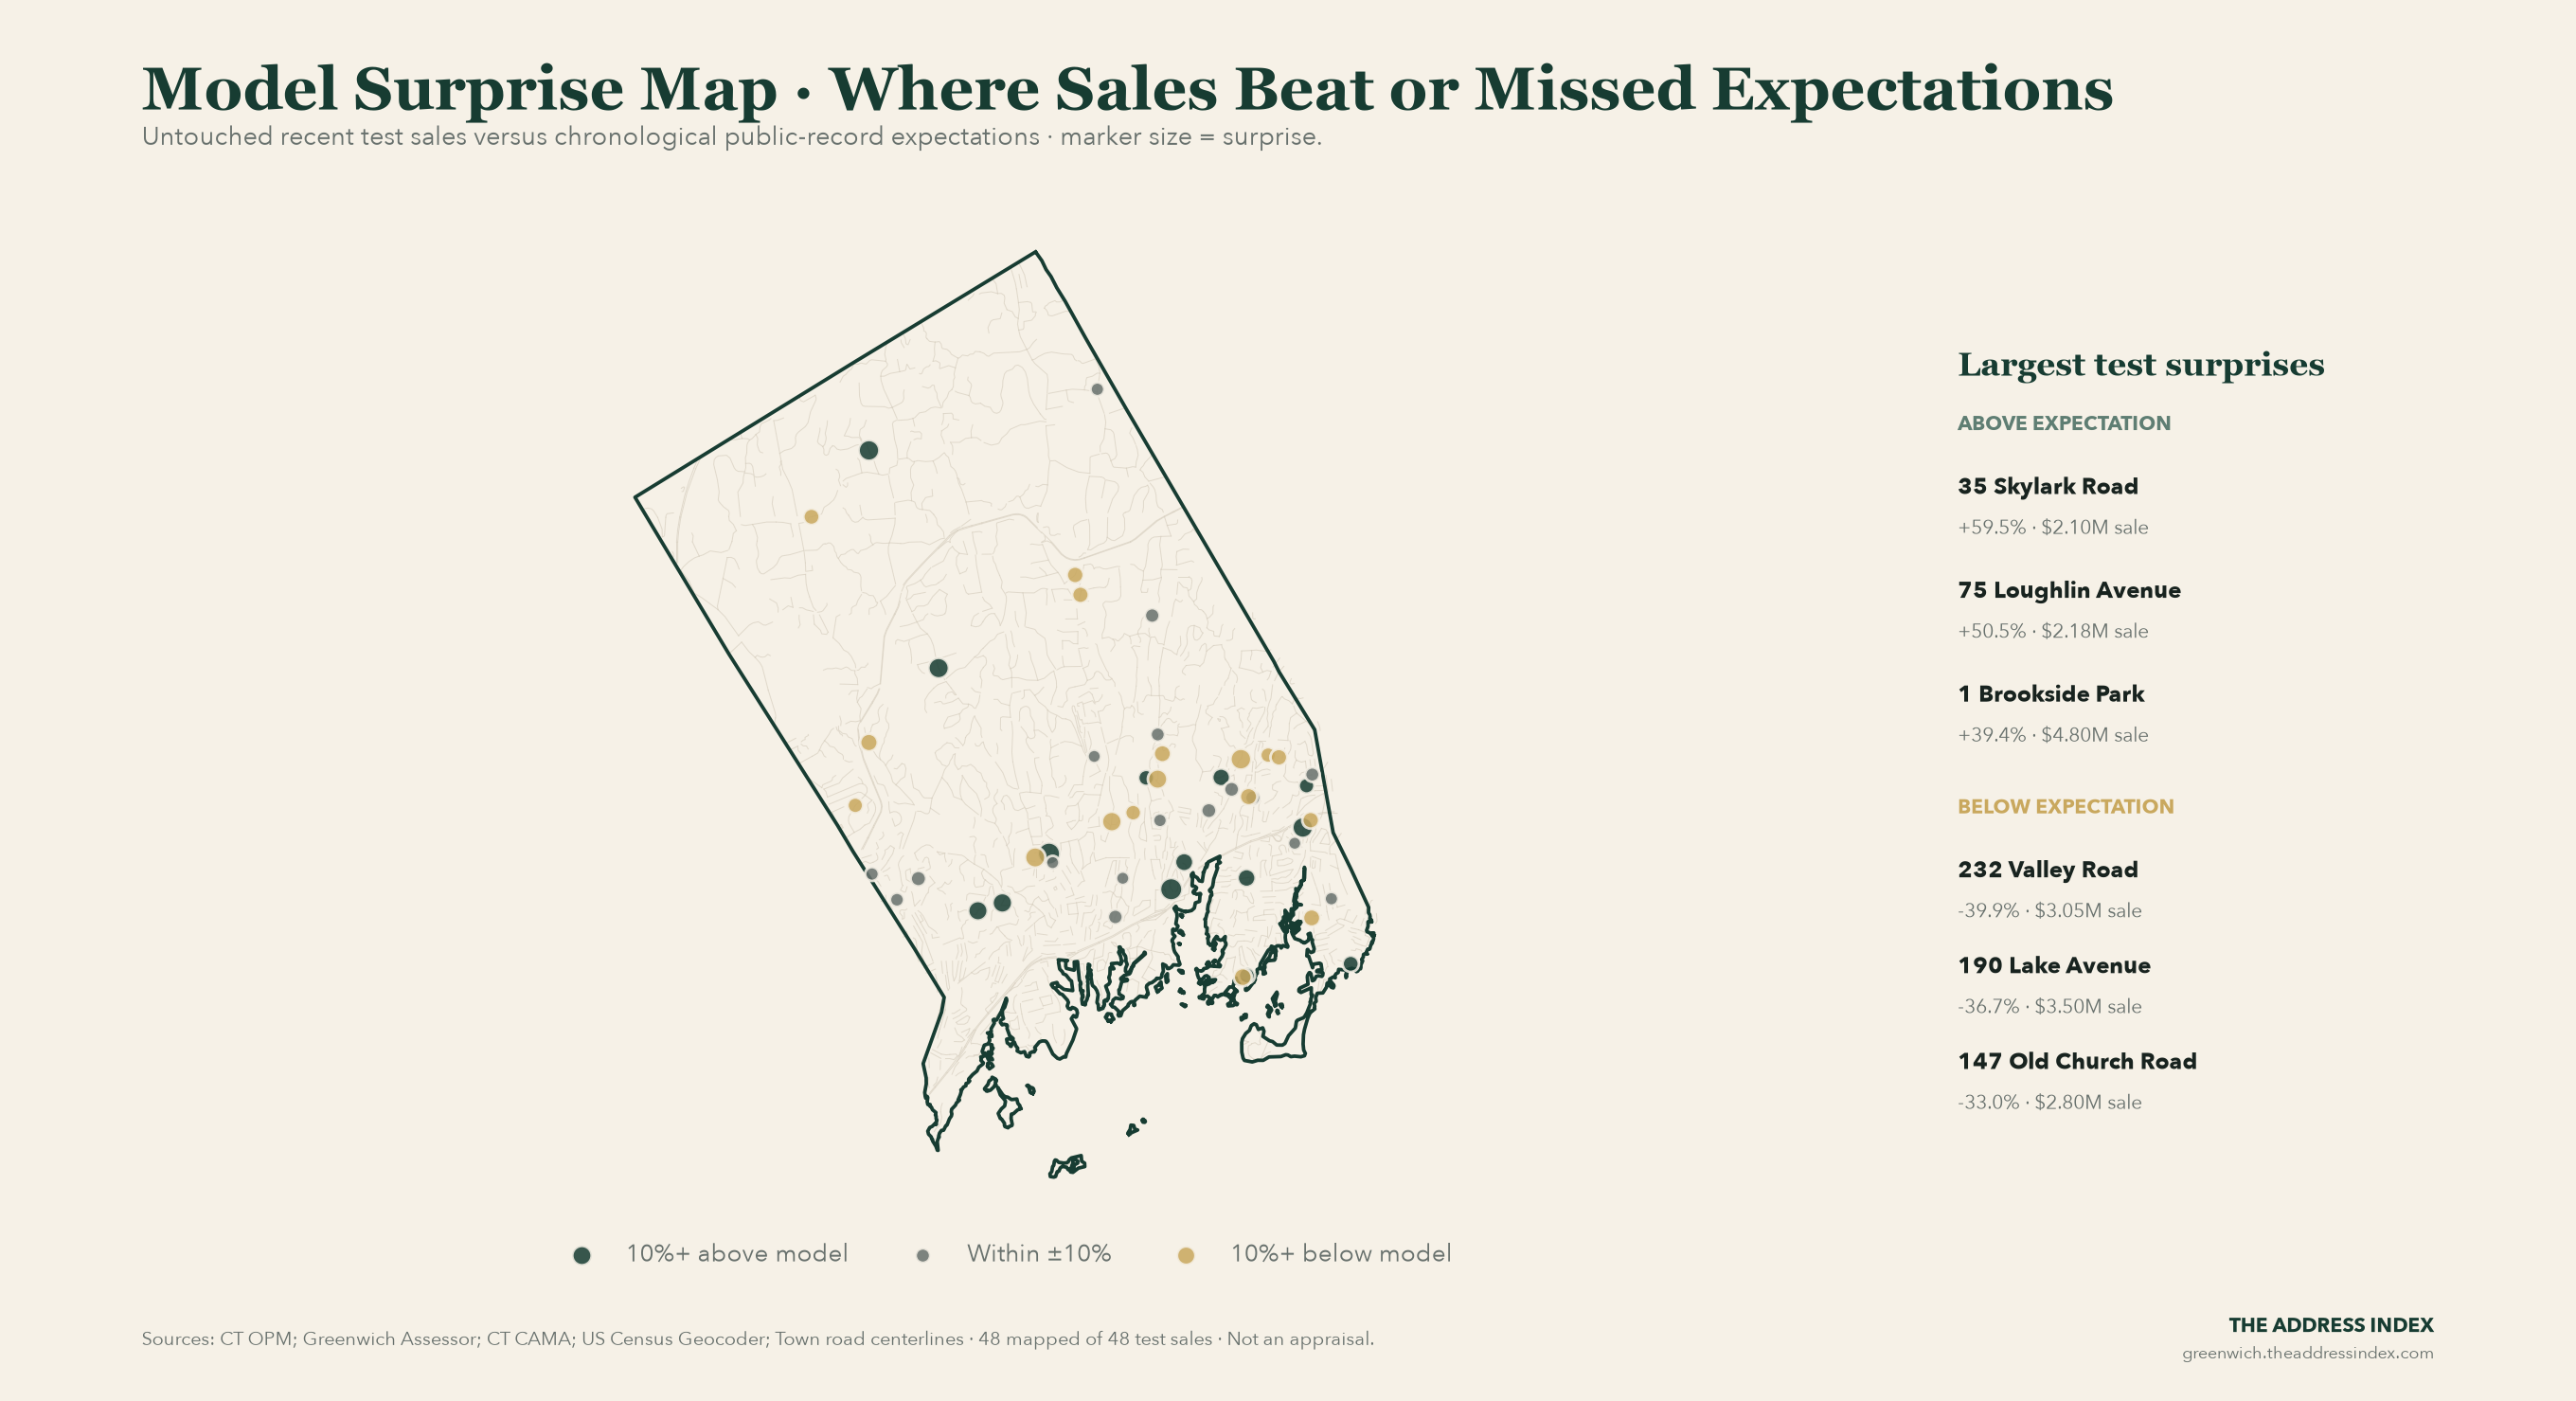
Across 48 untouched recent test sales, the median result was -22.2% versus the pre-sale public-record expectation; 46 have verified public coordinates. Select a point in the interactive dashboard to inspect the sale. This is model-error context, not an appraisal or a neighborhood ranking.
Get the next update to this chart in your inbox
Free subscribers receive previews and selected findings. Paid members get the complete Thursday briefing, property comparisons and dated follow-ups. Public research tools stay free.
Subscribe free for previews · Upgrade for the full Thursday edition. Prefer Substack? Subscribe there instead.
What this chart measures
The Model Surprise Map plots untouched recent test sales and colors each point by how far the actual price landed above or below its pre-sale public-record expectation.
How to read it
Green points cleared materially above the model, gold points below, and gray points near the expectation. The colors measure model error, not neighborhood quality or investment merit.
Why it matters
Patterns in model misses can reveal where public records are least complete and where private property features deserve additional investigation.
Latest reading: Across 48 untouched recent test sales, the median result was -22.2% versus the pre-sale public-record expectation; 46 have verified public coordinates. Select a point in the interactive dashboard to inspect the sale. This is model-error context, not an appraisal or a neighborhood ranking.
The Address Index is independent market intelligence based on public and source-linked records. It is not an appraisal, brokerage opinion, or investment recommendation.
Related Greenwich real estate charts
Get the complete Greenwich briefing.
Paid members receive the complete Thursday briefing, property case studies, dated follow-ups and the paid archive. When a new monthly report arrives, our State of Greenwich analysis puts the numbers in context.
The research desk is public during launch. Free subscribers receive previews and selected findings.
Get the complete briefing on Substack